Retail NorthOwn login
93.8%Q3 2026-3.2 pts
Q4 202497% lineQ3 2026
FlaggedStore 4410 holds 260 crates unscanned for 30 days. Without it, the loop stays at 97.2%.
PPWR reuse reporting
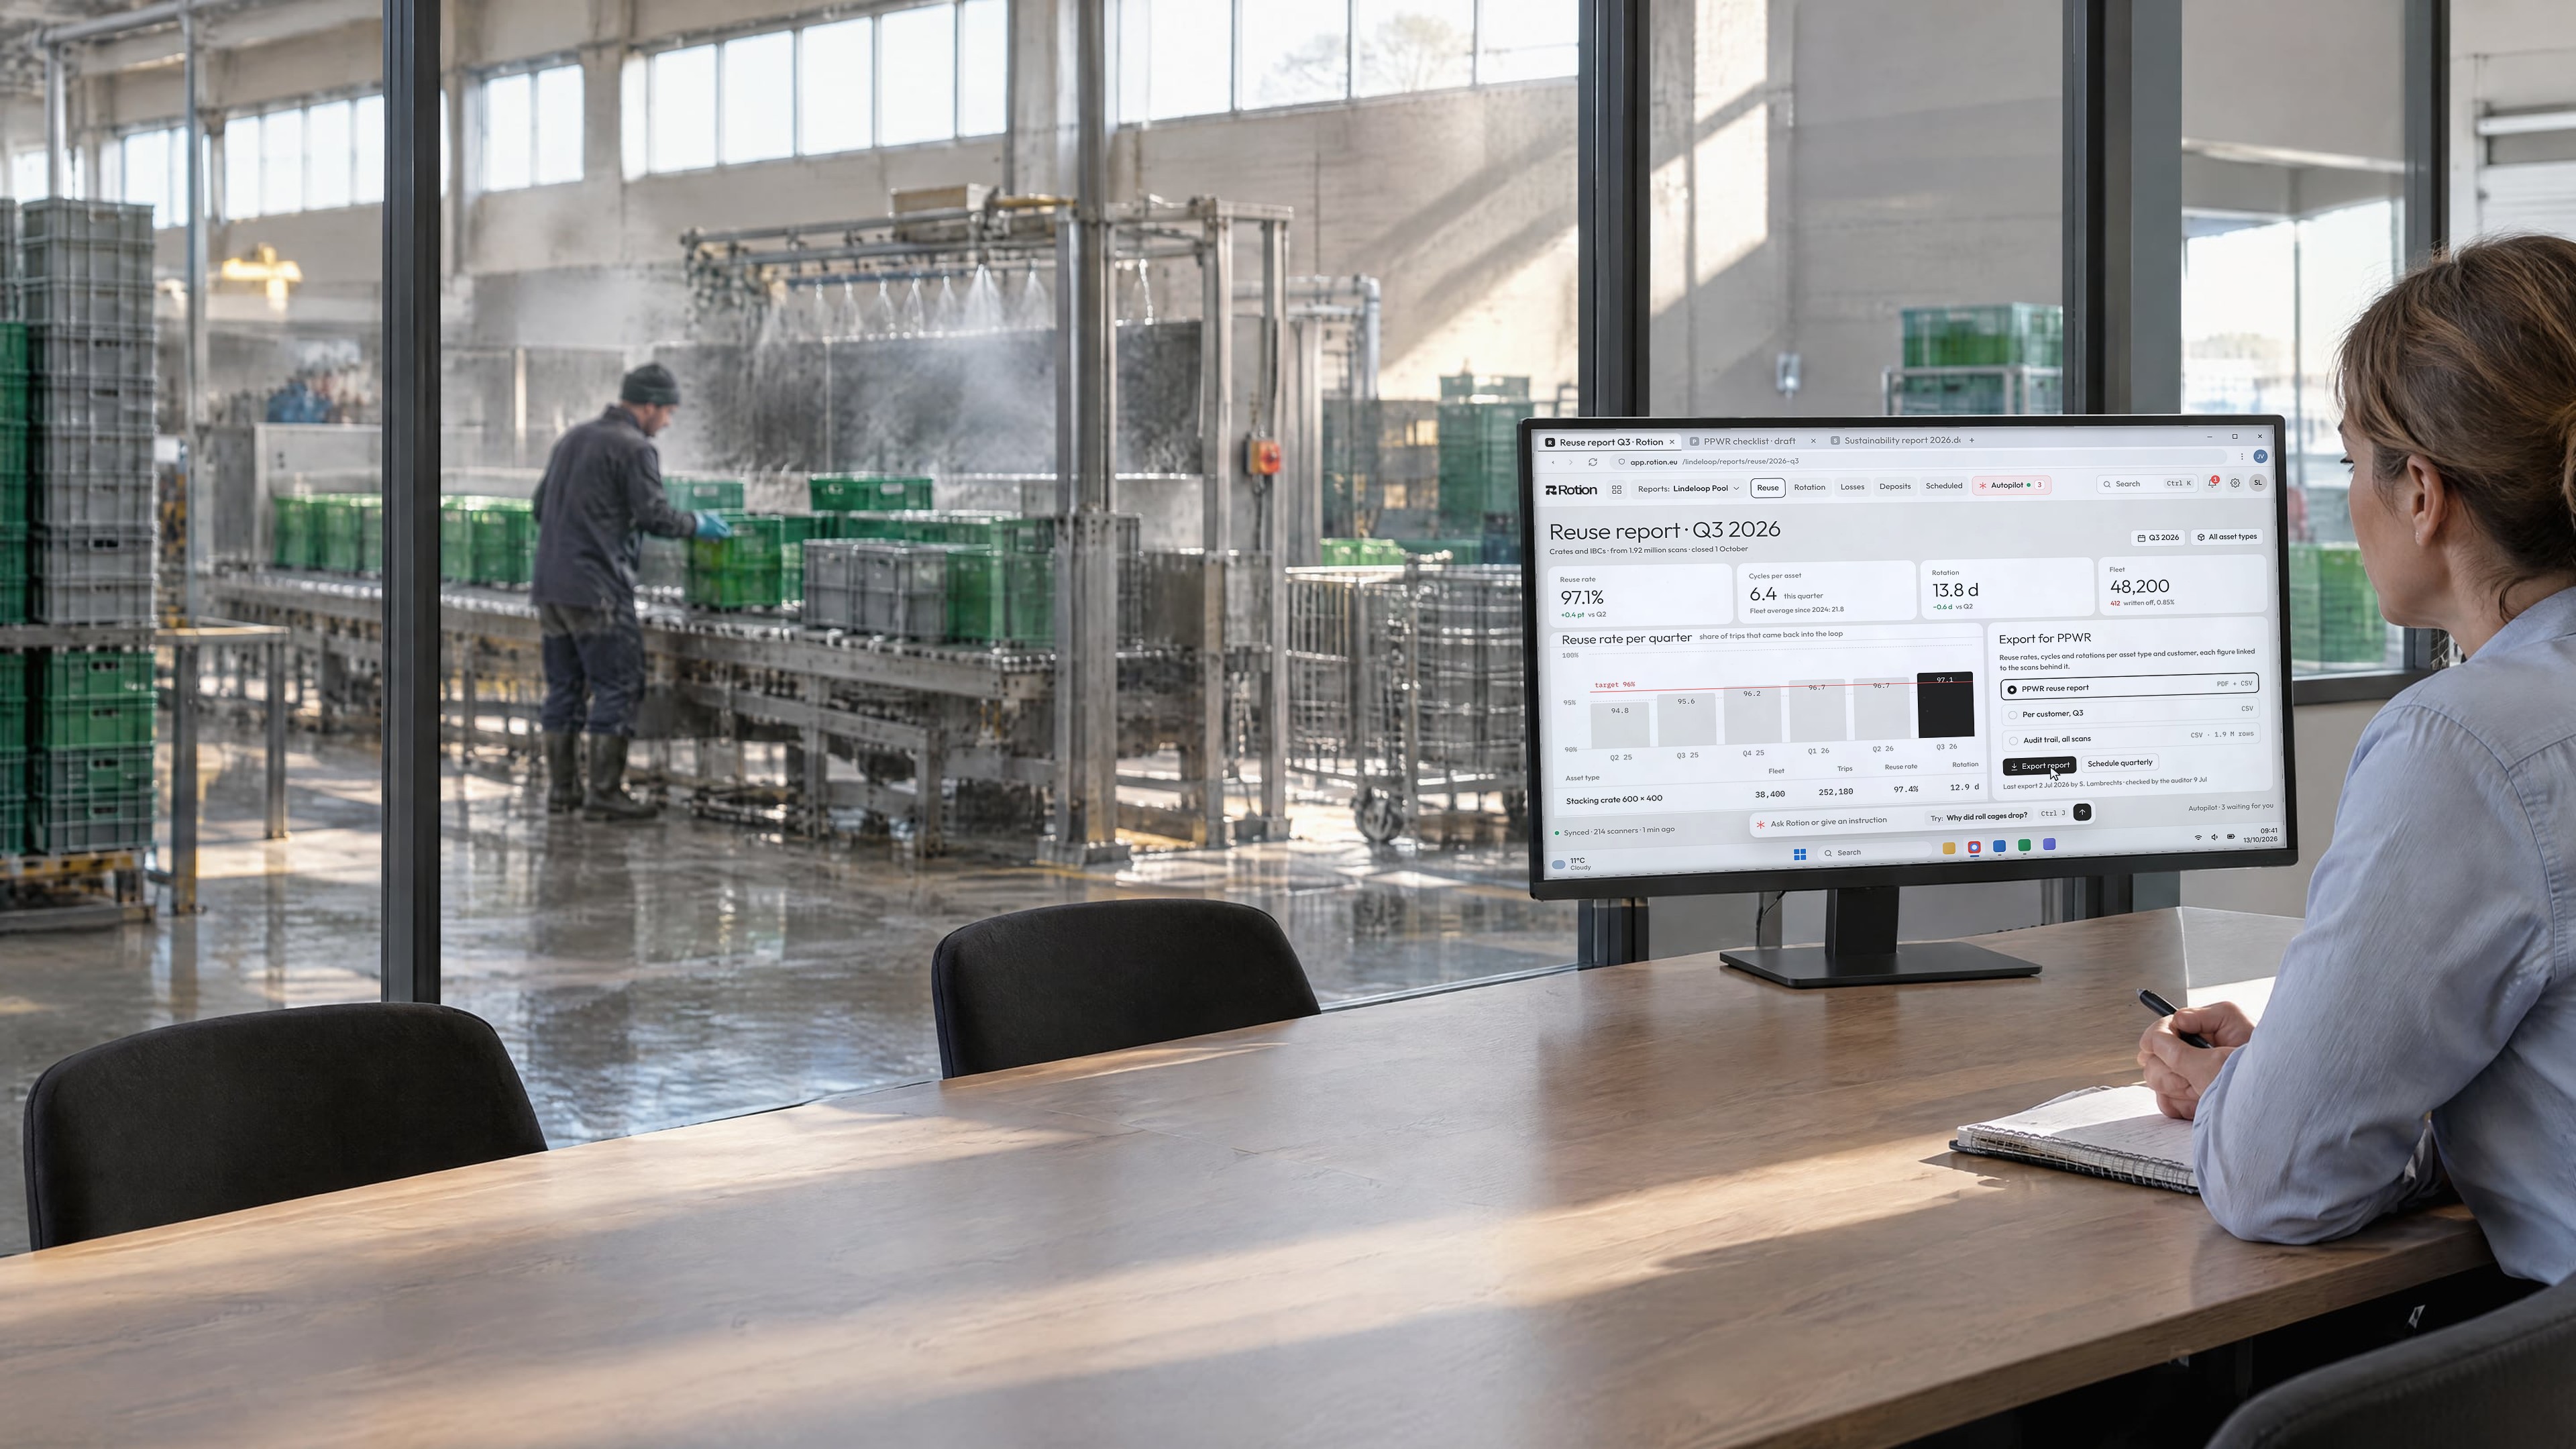
Rotion turns every scan into reuse rates, cycle counts and rotations per asset type, customer and period. Your PPWR evidence comes from the scans in your own operation.
PPWR reuse reporting is the evidence that reusable packaging is actually reused, as required by the EU Packaging and Packaging Waste Regulation, Regulation (EU) 2025/40. Calculation rules apply from 30 June 2027 and reuse targets from 2030. Rotion calculates reuse rates, cycles per asset and rotations from asset-level scans, per customer and period, and exports them.
Each rate is counted per asset, from the scans at every handover. Split it by packaging category, loop or customer and period. Open any figure to see the returns, pending items and losses behind it.
Pool operator North, sample data. 1 Jul to 30 Sep 2026.
| Packaging category | In circulation | Cycles completed | Reuse rate | Rotations per item | Days per rotation | Lost |
|---|---|---|---|---|---|---|
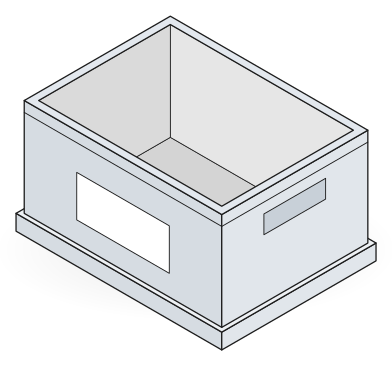
 Crates | 48,200 | 41,350 | 97.1% | 6.4 | 13.8 | 412 |
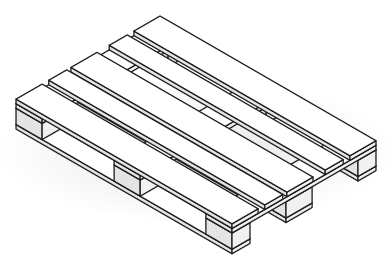 Pallets | 12,600 | 9,880 | 95.4% | 4.1 | 21.0 | 188 |
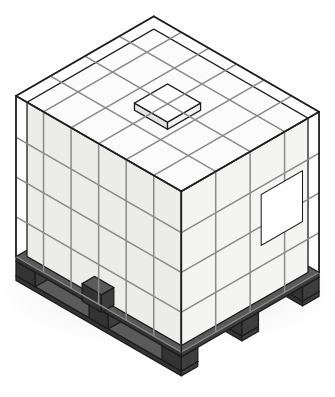 IBCs | 2,140 | 1,310 | 98.2% | 3.2 | 26.5 | 12 |
CSV, PDF or XLSX, on a schedule by email, or through the API.
A read-only login for your auditor, with the scans behind each figure.
The same figures give your CSRD team the numbers behind its circular economy disclosures.
One set of figures serves the regulator, your customers and your own planning. Pick a feature to see it.
Explore the platform Reuse reportsRotation per loopFleet statusCycle history Autopilot
| Customer | Rotations | Reuse |
|---|---|---|
| Retailer 3 | 412,300 | 94.1% |
| Filler 07 | 288,100 | 92.7% |
| Grower co-op 2 | 196,400 | 95.3% |
Reuse figures come from the same record that runs the loop. Nothing is collected separately for reporting.
Every issue, return and wash is recorded per asset, by your team and your partners.
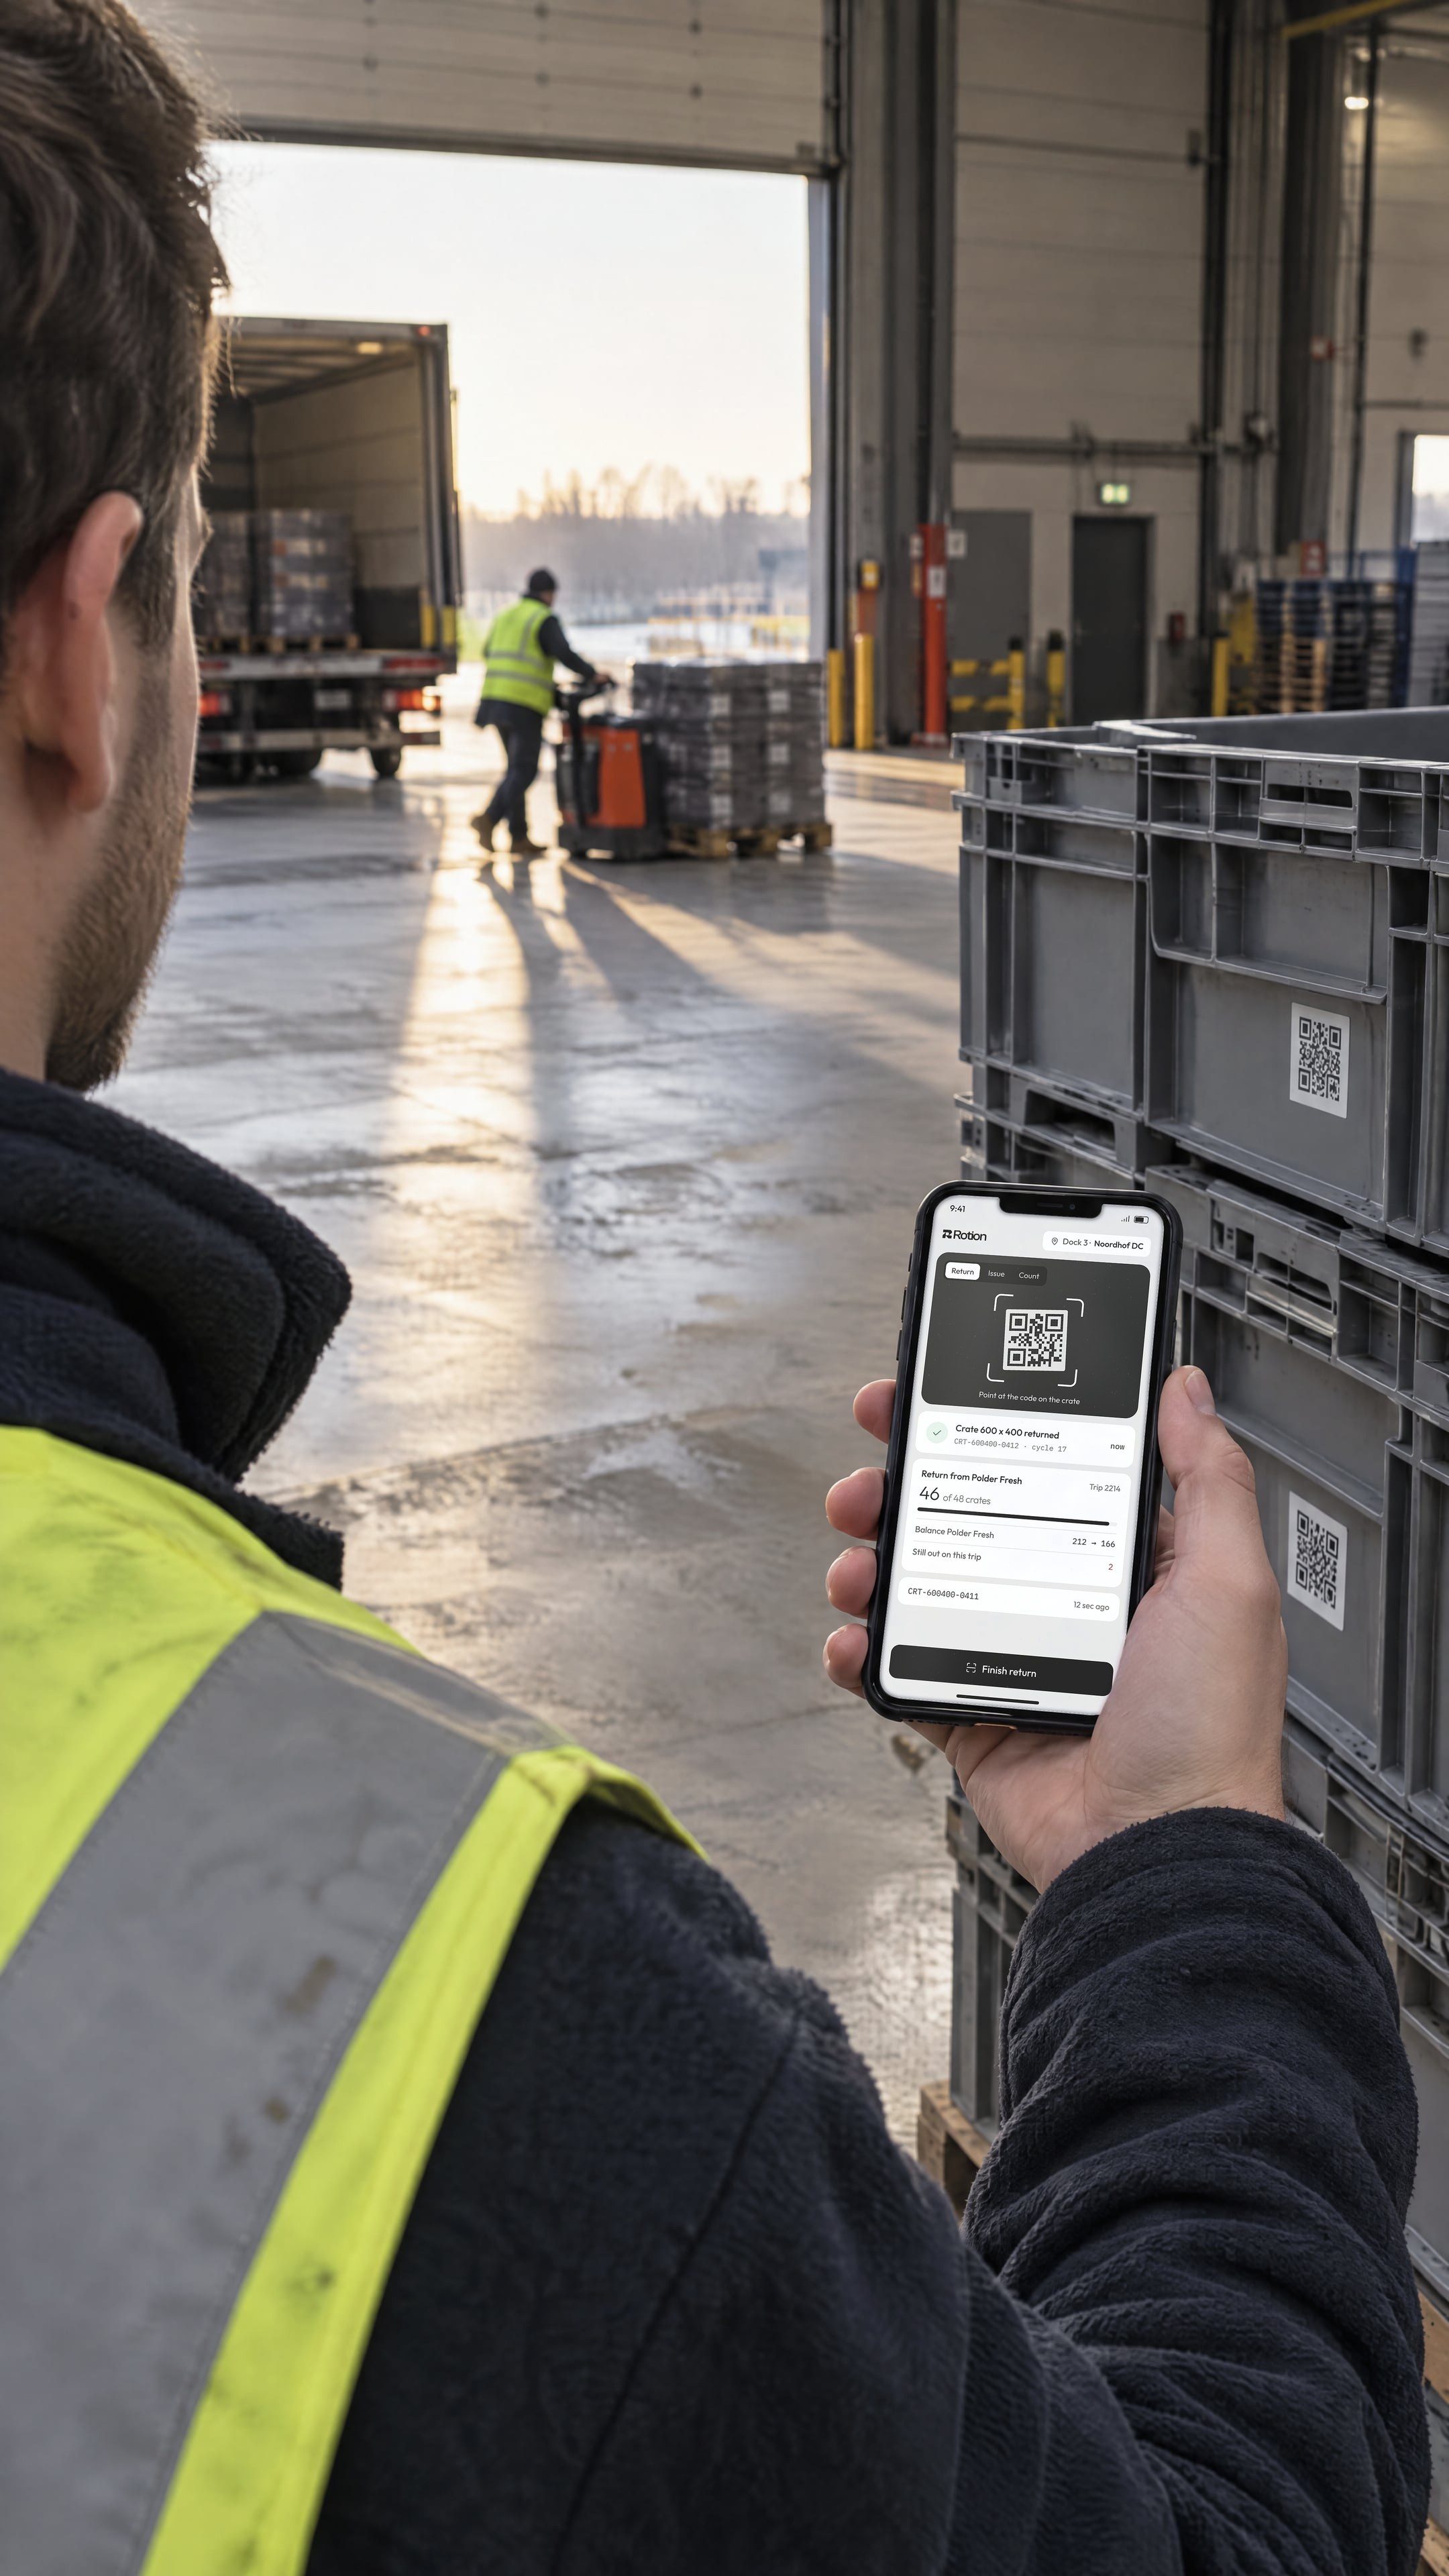
A completed loop adds a cycle to the asset’s passport. Losses and retirements are recorded too.
Reuse rate, cycles per asset and rotation time are calculated per asset type, customer and period.

Reports export as CSV or PDF, or flow to your ERP and sustainability tools through the API.

The dates in the regulation are fixed. Your scan history starts on the day you start tracking. Every quarter you count now is a quarter of baseline when the calculation rules and targets apply.
Quarters counted from the start of tracking. Check your own deadlines in the PPWR Navigator.
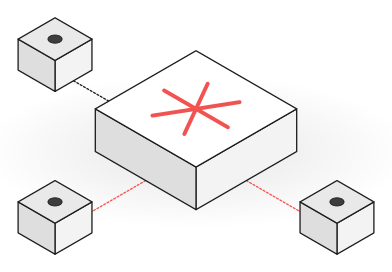
Autopilot watches every scan in your loop, flags what is going wrong, proposes the fix with its reasoning, and acts once you approve.
How Autopilot worksThe reuse rate in the Retail North loop fell from 97.4% to 93.8% in September.
Most of the drop comes from Store 4410, where 260 crates have not been scanned back for 30 days. Without it, the loop stays at 97.2%.
Add a collection at Store 4410 and mark its crates as pending in the Q3 report until they are scanned.
The same scans split by customer or loop. Each card shows eight quarters on one scale, so a dip stands out, and the reason behind it is one click away.
FlaggedStore 4410 holds 260 crates unscanned for 30 days. Without it, the loop stays at 97.2%.
Each customer can log in to its own report.
Field results from operators running Rotion across pools, retail and industry.














PPWR, Regulation (EU) 2025/40, sets reuse targets for transport and sales packaging, and requires operators to evidence that reusable packaging actually circulates. Calculation rules apply from 30 June 2027 and reuse targets from 2030. The PPWR Navigator lists the deadlines that apply to you.
Rotion counts completed cycles, returns, losses and retirements per asset from the scan record. From those it calculates the reuse rate, cycles per asset and rotation time per asset type, customer and period. Every figure links back to the scans behind it.
Yes. Reports can be split by customer, loop, site, asset type and period. Pool operators use this to give each customer its own reuse figures.
Reports export as CSV and PDF. Through the REST API and webhooks, reuse figures can also flow into your ERP, data warehouse or sustainability reporting tools.
Asset-level scans give you reuse figures you can trace back to actual handovers, rather than estimates from purchases and stock counts. Read the PPWR reuse reporting guide for the requirements and options.
 IMG 052 · DC Zellik · 50.8889N 4.2725E
Most teams go live in weeks, on the codes already on their fleet.
AI assistant · answers about Rotion
Hi. Ask me anything about Rotion: how it tracks crates, pallets, kegs and IBCs across partners, what Autopilot does, pricing, or PPWR.