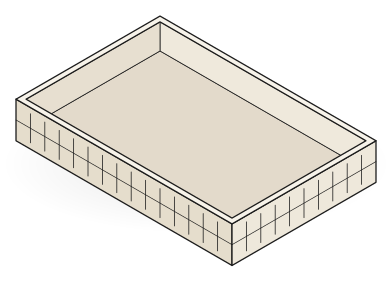
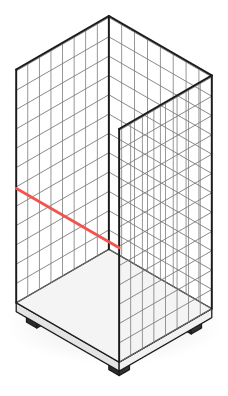
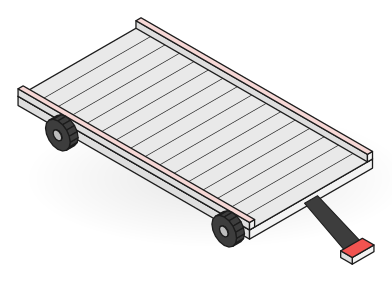
Tally sheets drift.
Paper counts agree on delivery day and drift apart afterwards. By month end, nobody trusts the balance.
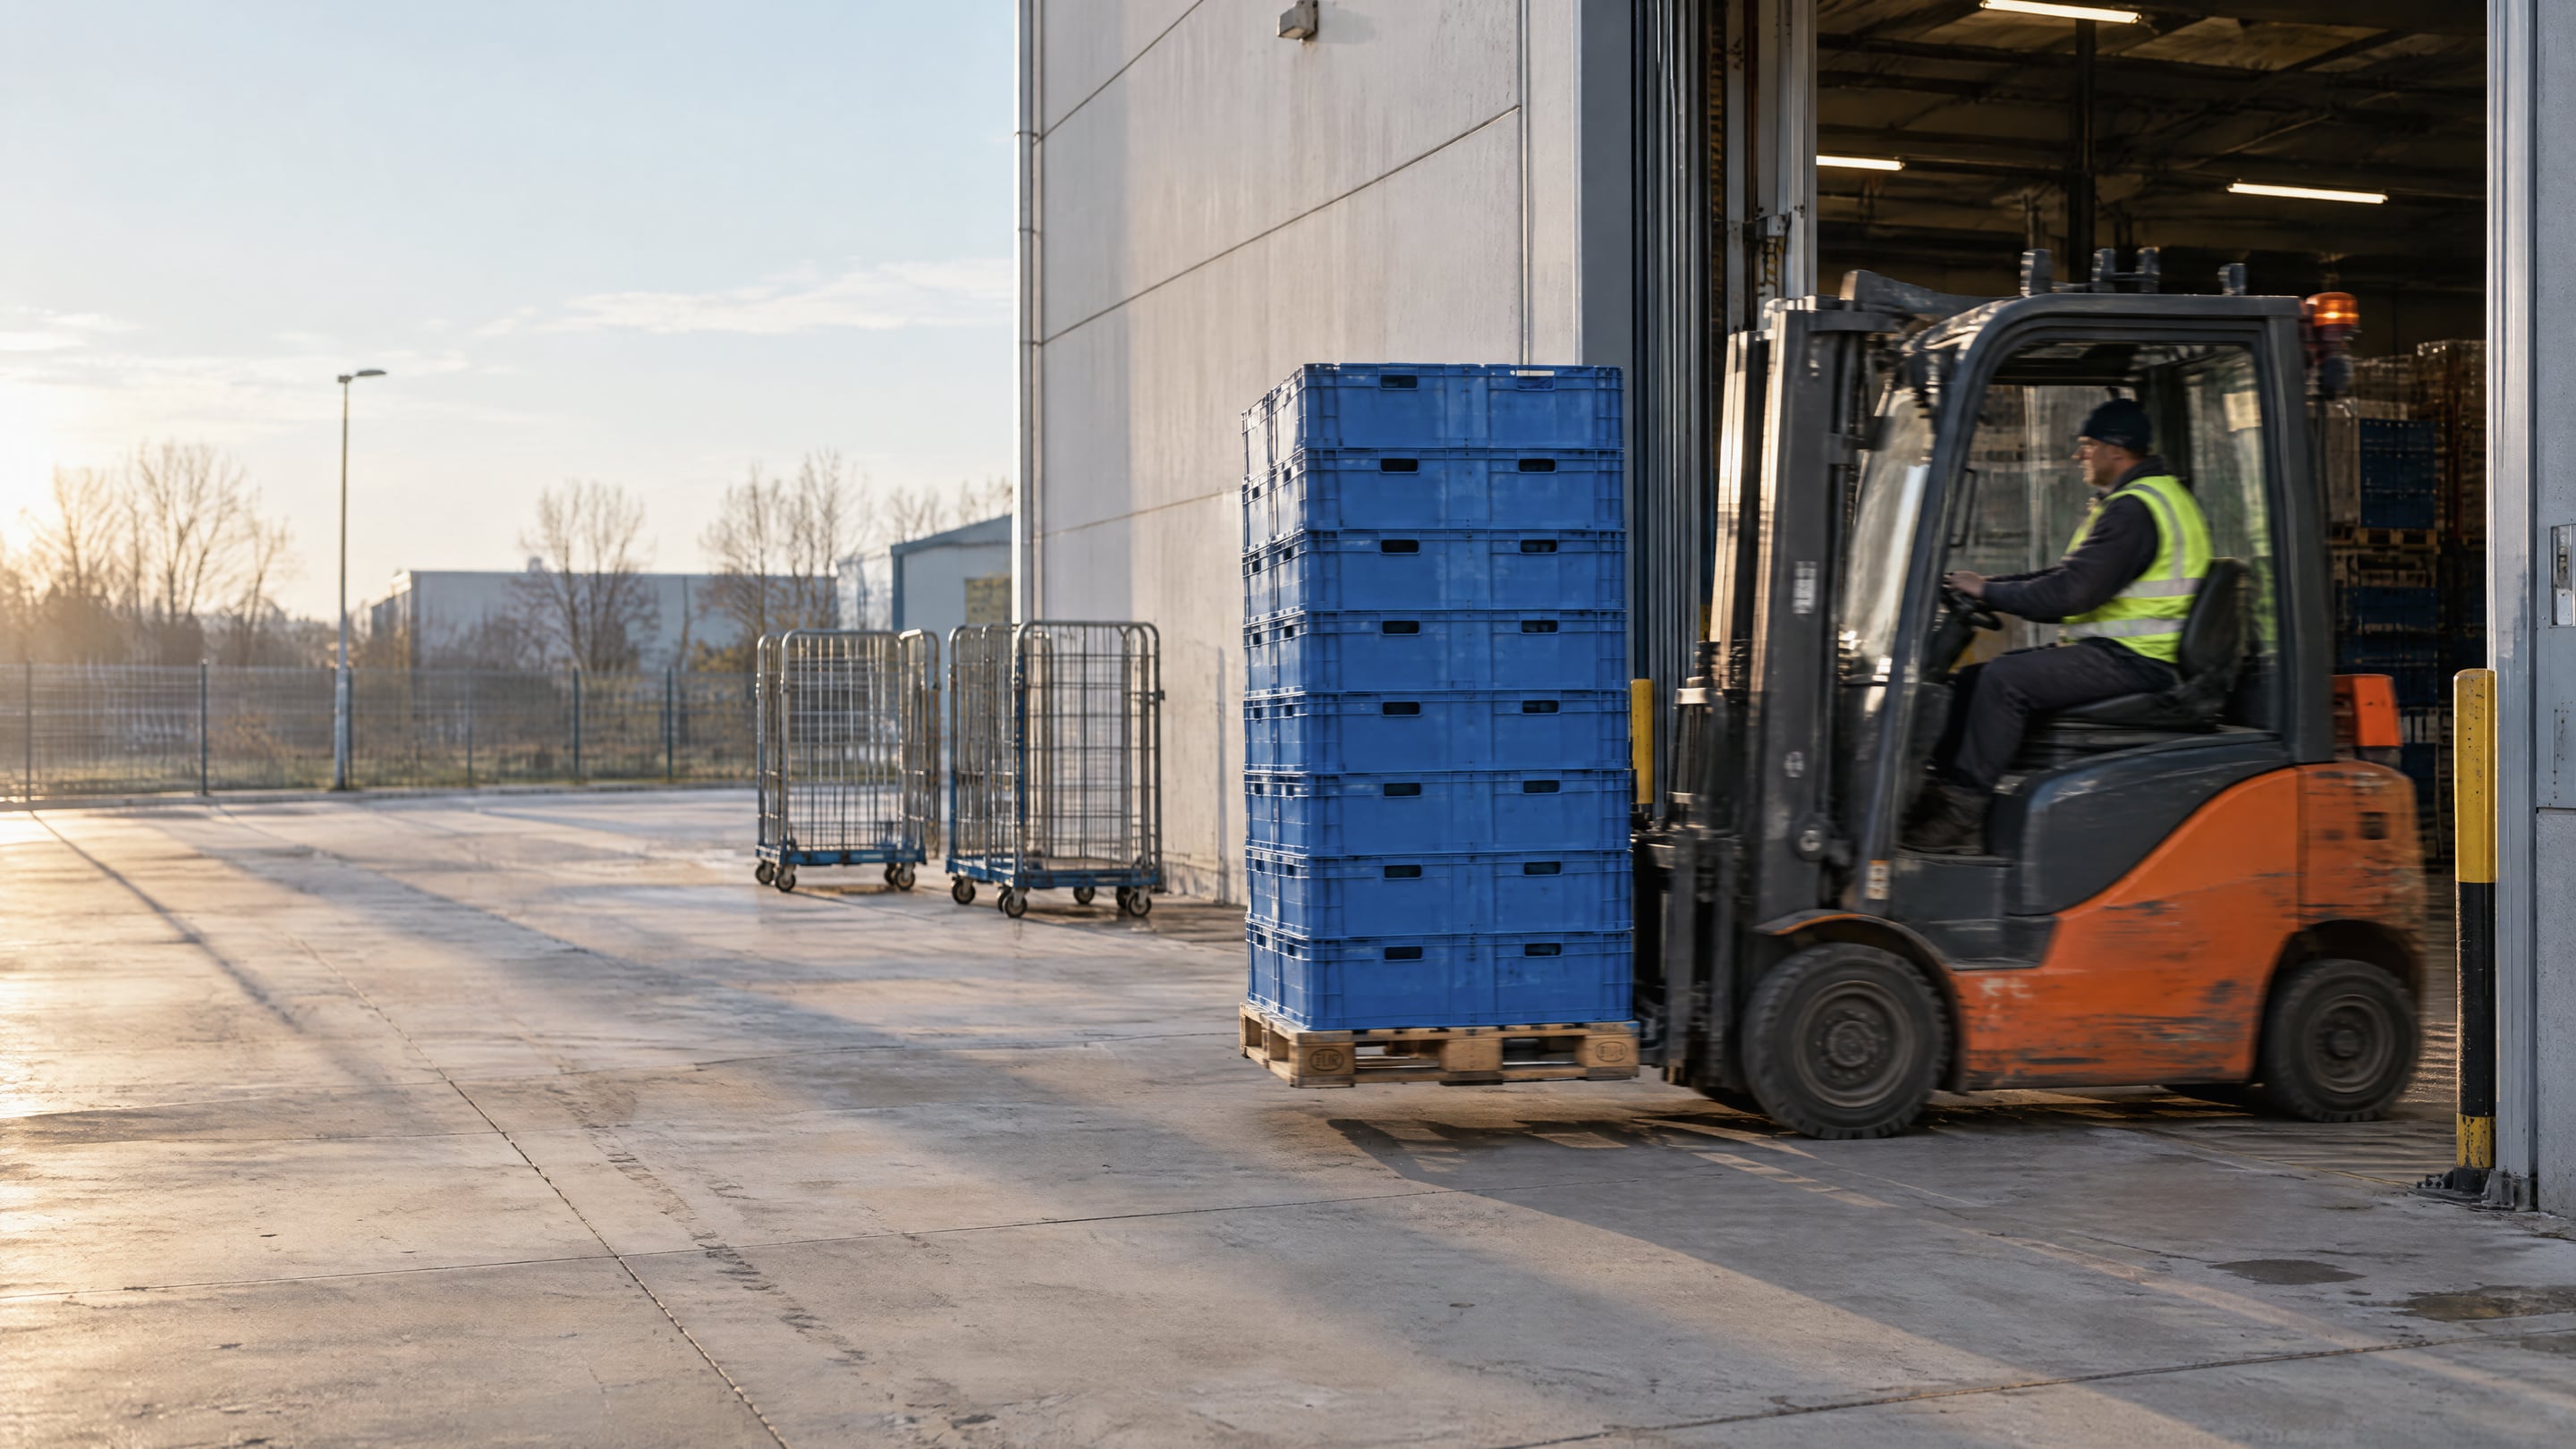
Crate tracking software
Rotion gives every returnable crate a digital identity. See which customer holds which crates, follow every rotation through the wash line, and get more of them back.
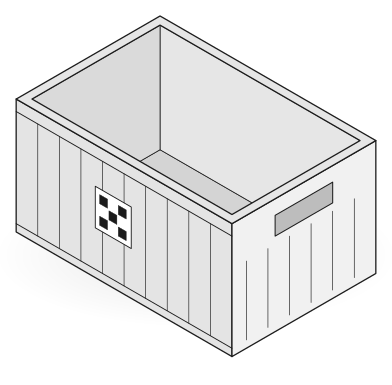
Crate tracking software records where each returnable crate is, who holds it and how it rotates between growers, distribution centers, stores and wash lines. Rotion does this per crate, on the QR, barcode or RFID codes already on your fleet. Customer balances, losses and wash capacity then come from scans instead of tally sheets.
Crates leave with every order and come back when customers get around to it. Every crate that does not come back is bought twice.
Paper counts agree on delivery day and drift apart afterwards. By month end, nobody trusts the balance.
A few customers hold far more crates than they need. Without per-crate data, you only notice at the next shortage.
A pool’s real capacity is its rotation through washing. Queues at the wash line look like shortages elsewhere.
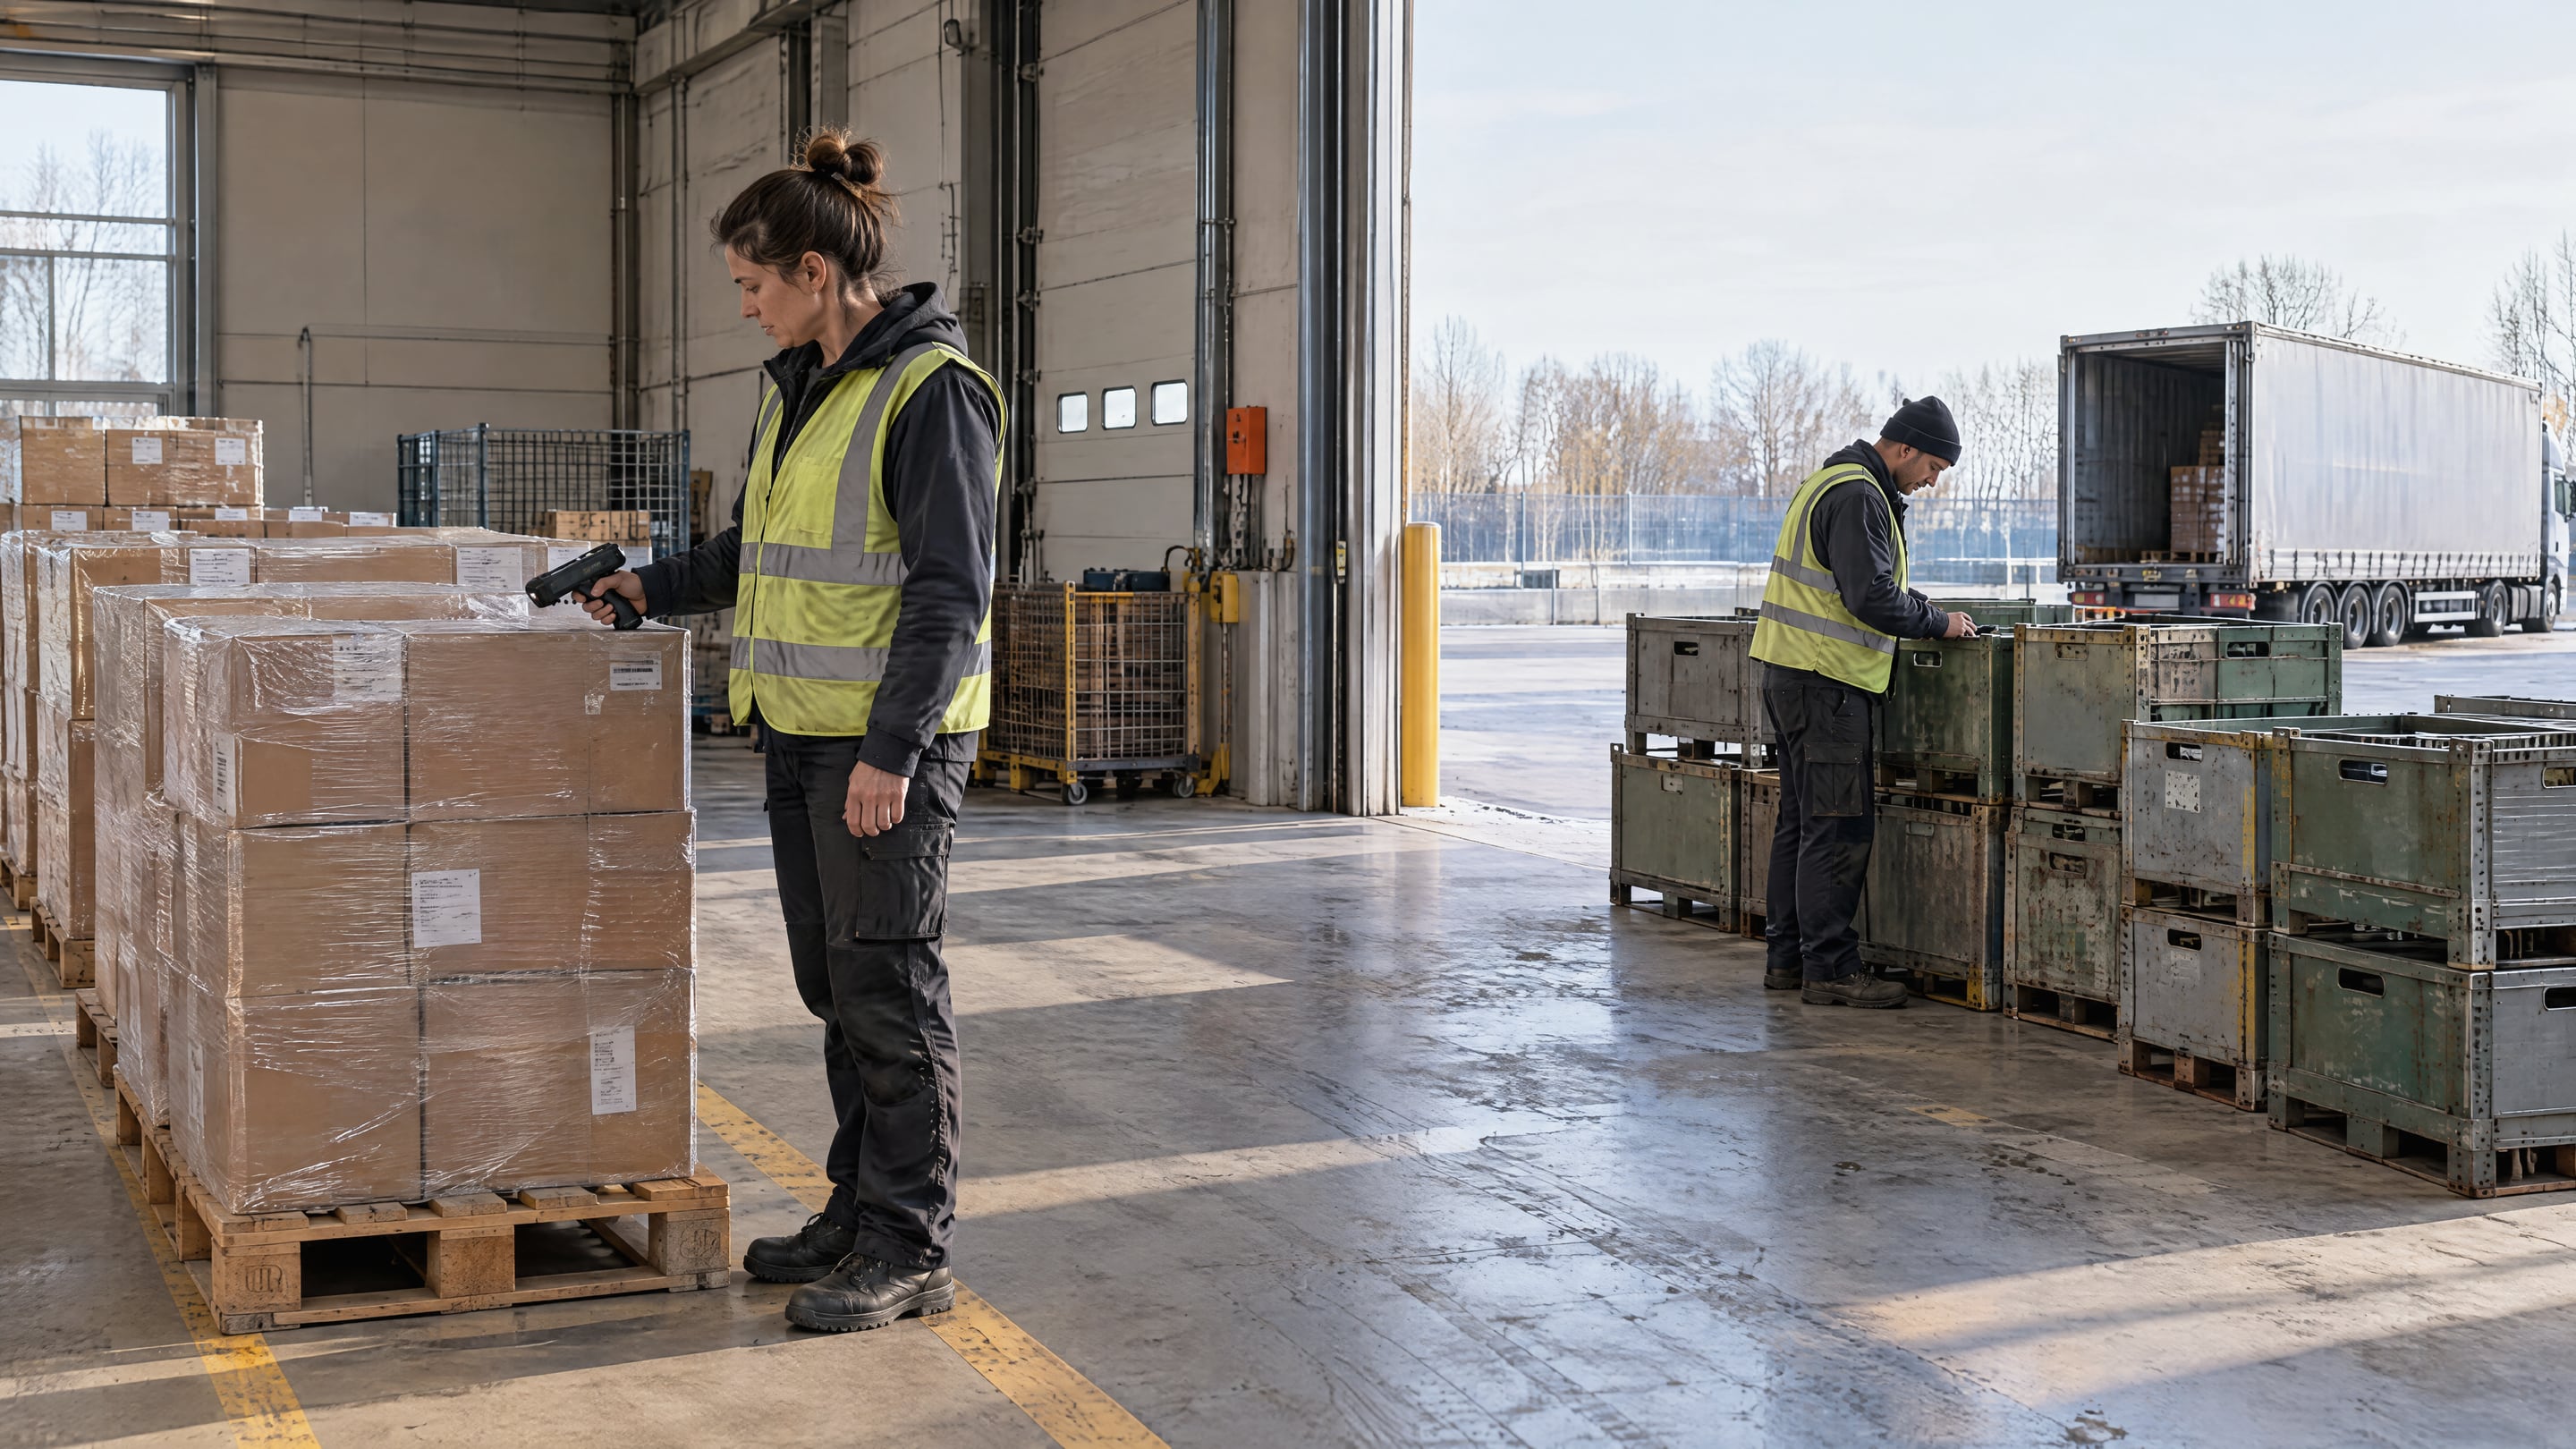
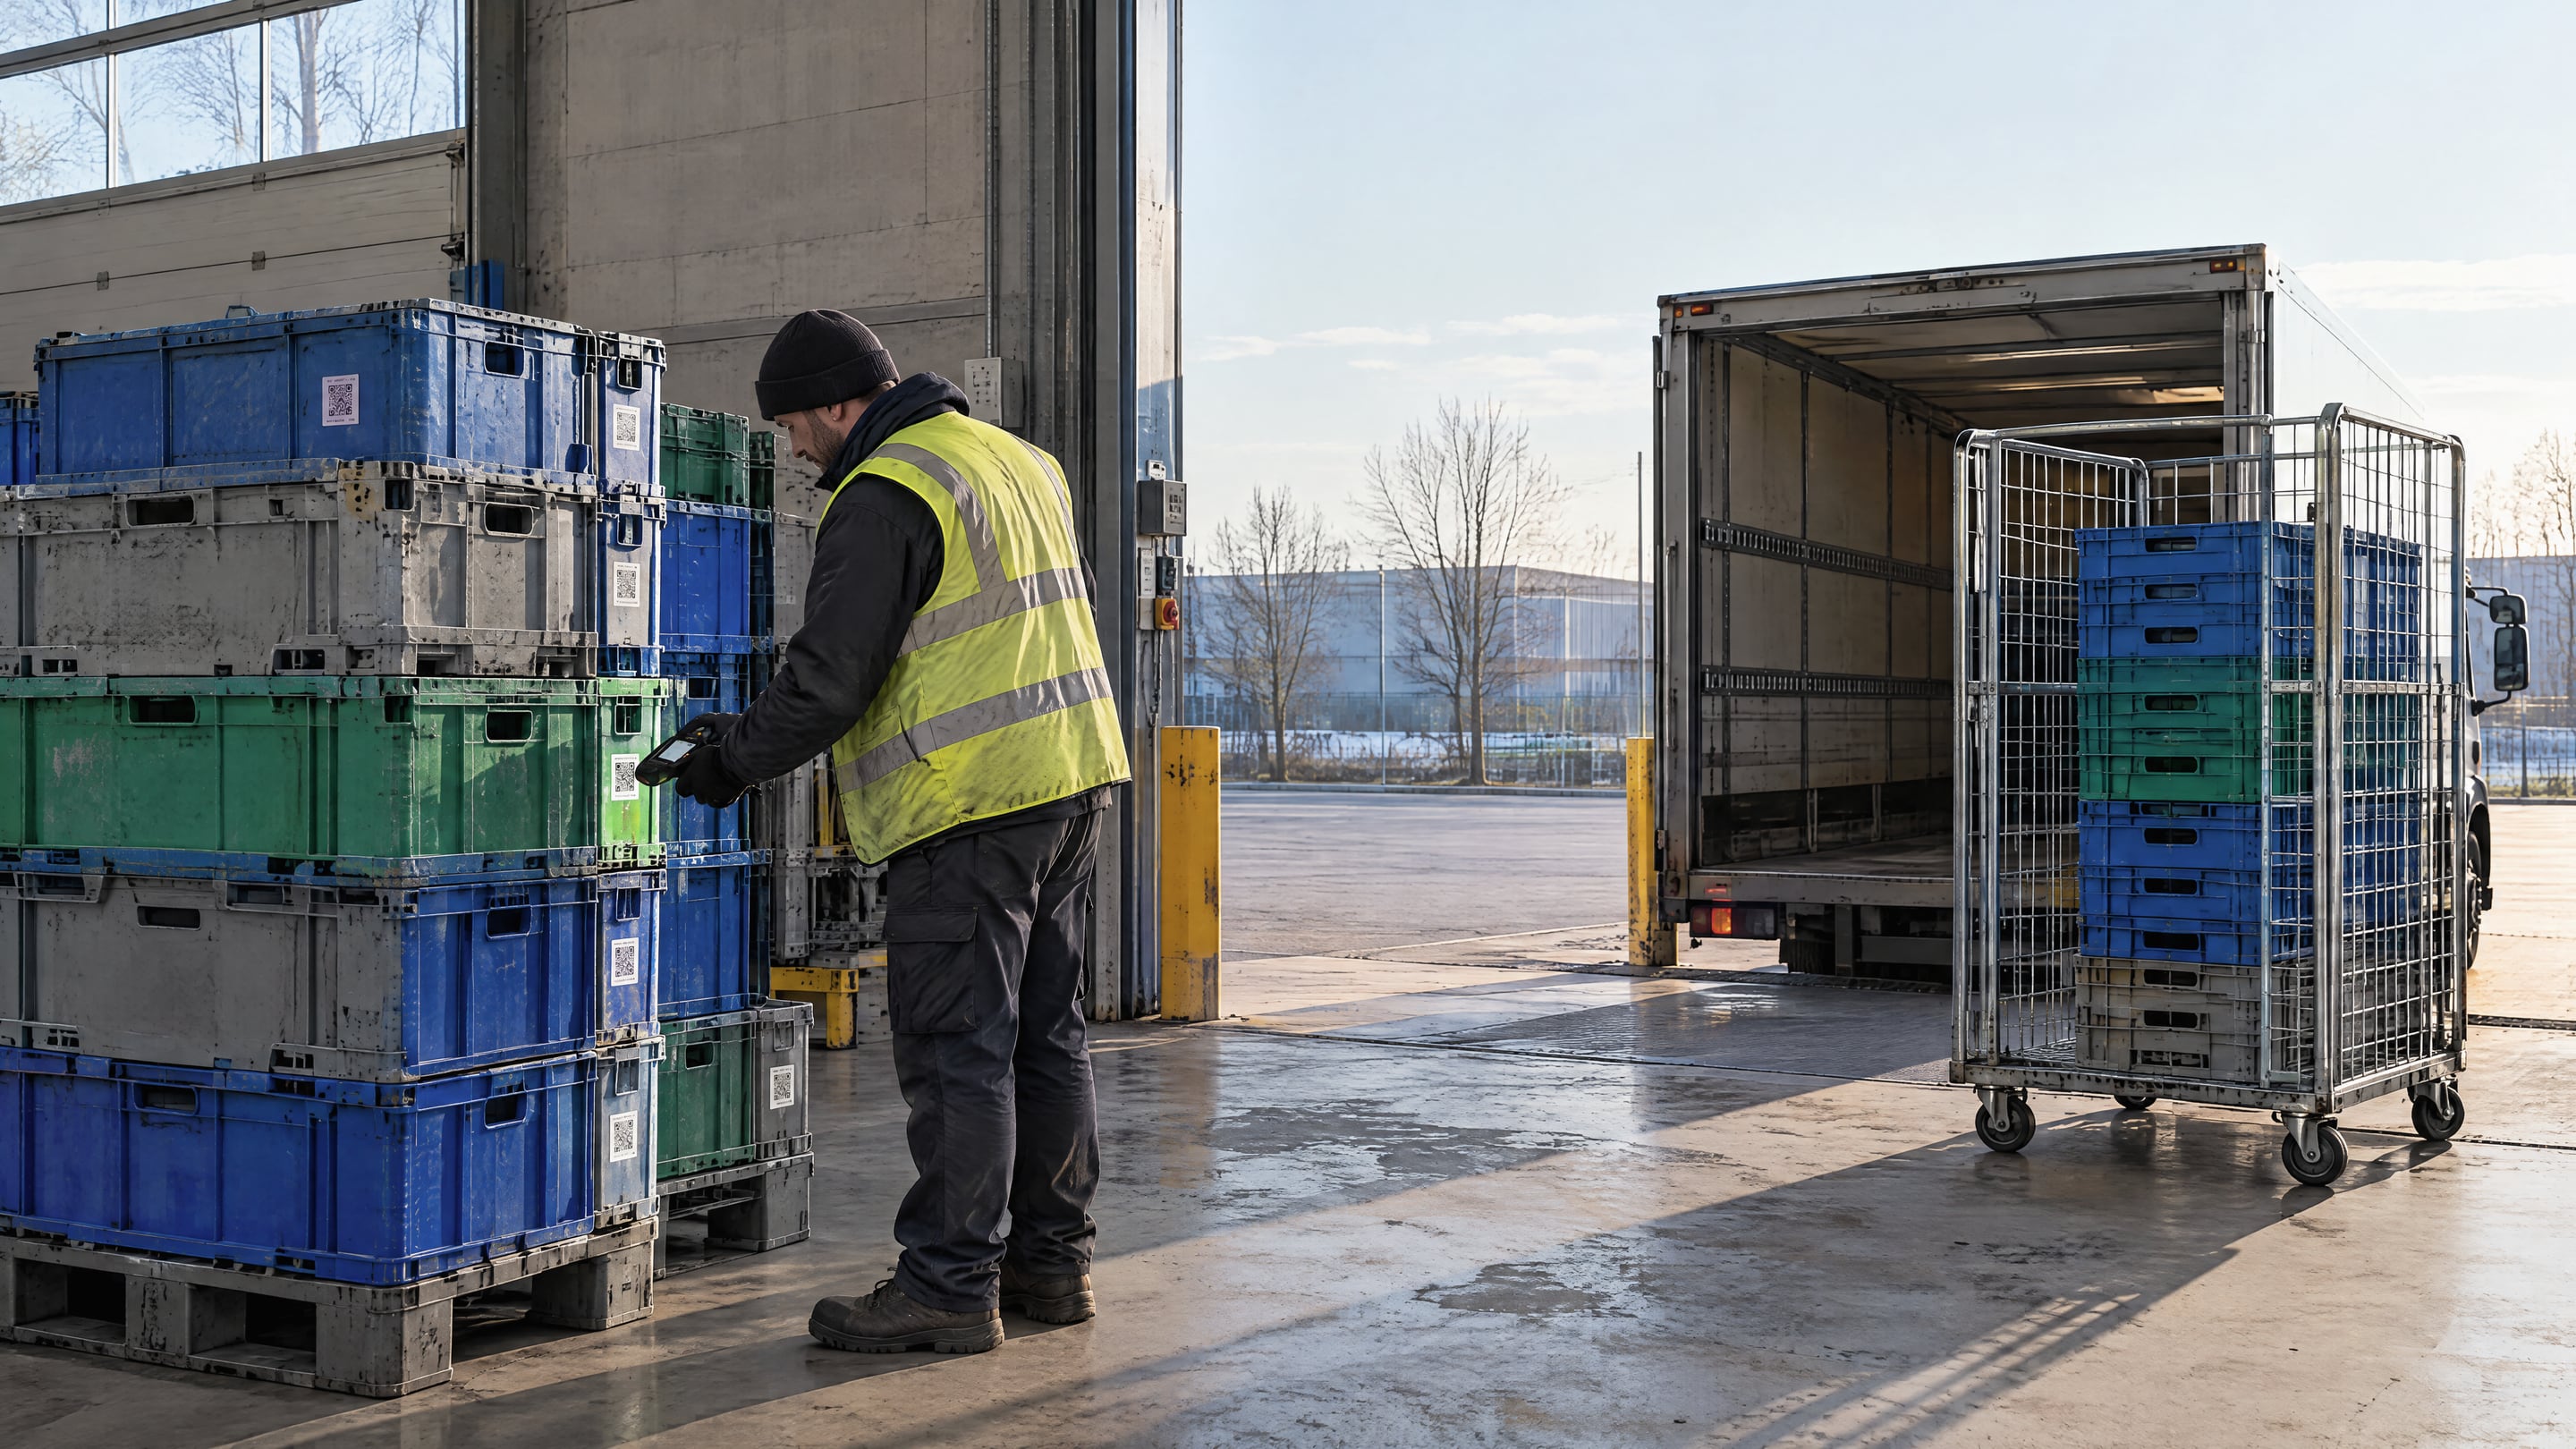
Drivers and customers scan at handover with any phone. Stacks scan as one batch, and every crate stays traceable.
Crates leave the packing line on a delivery. One SSCC scan covers the whole stack.
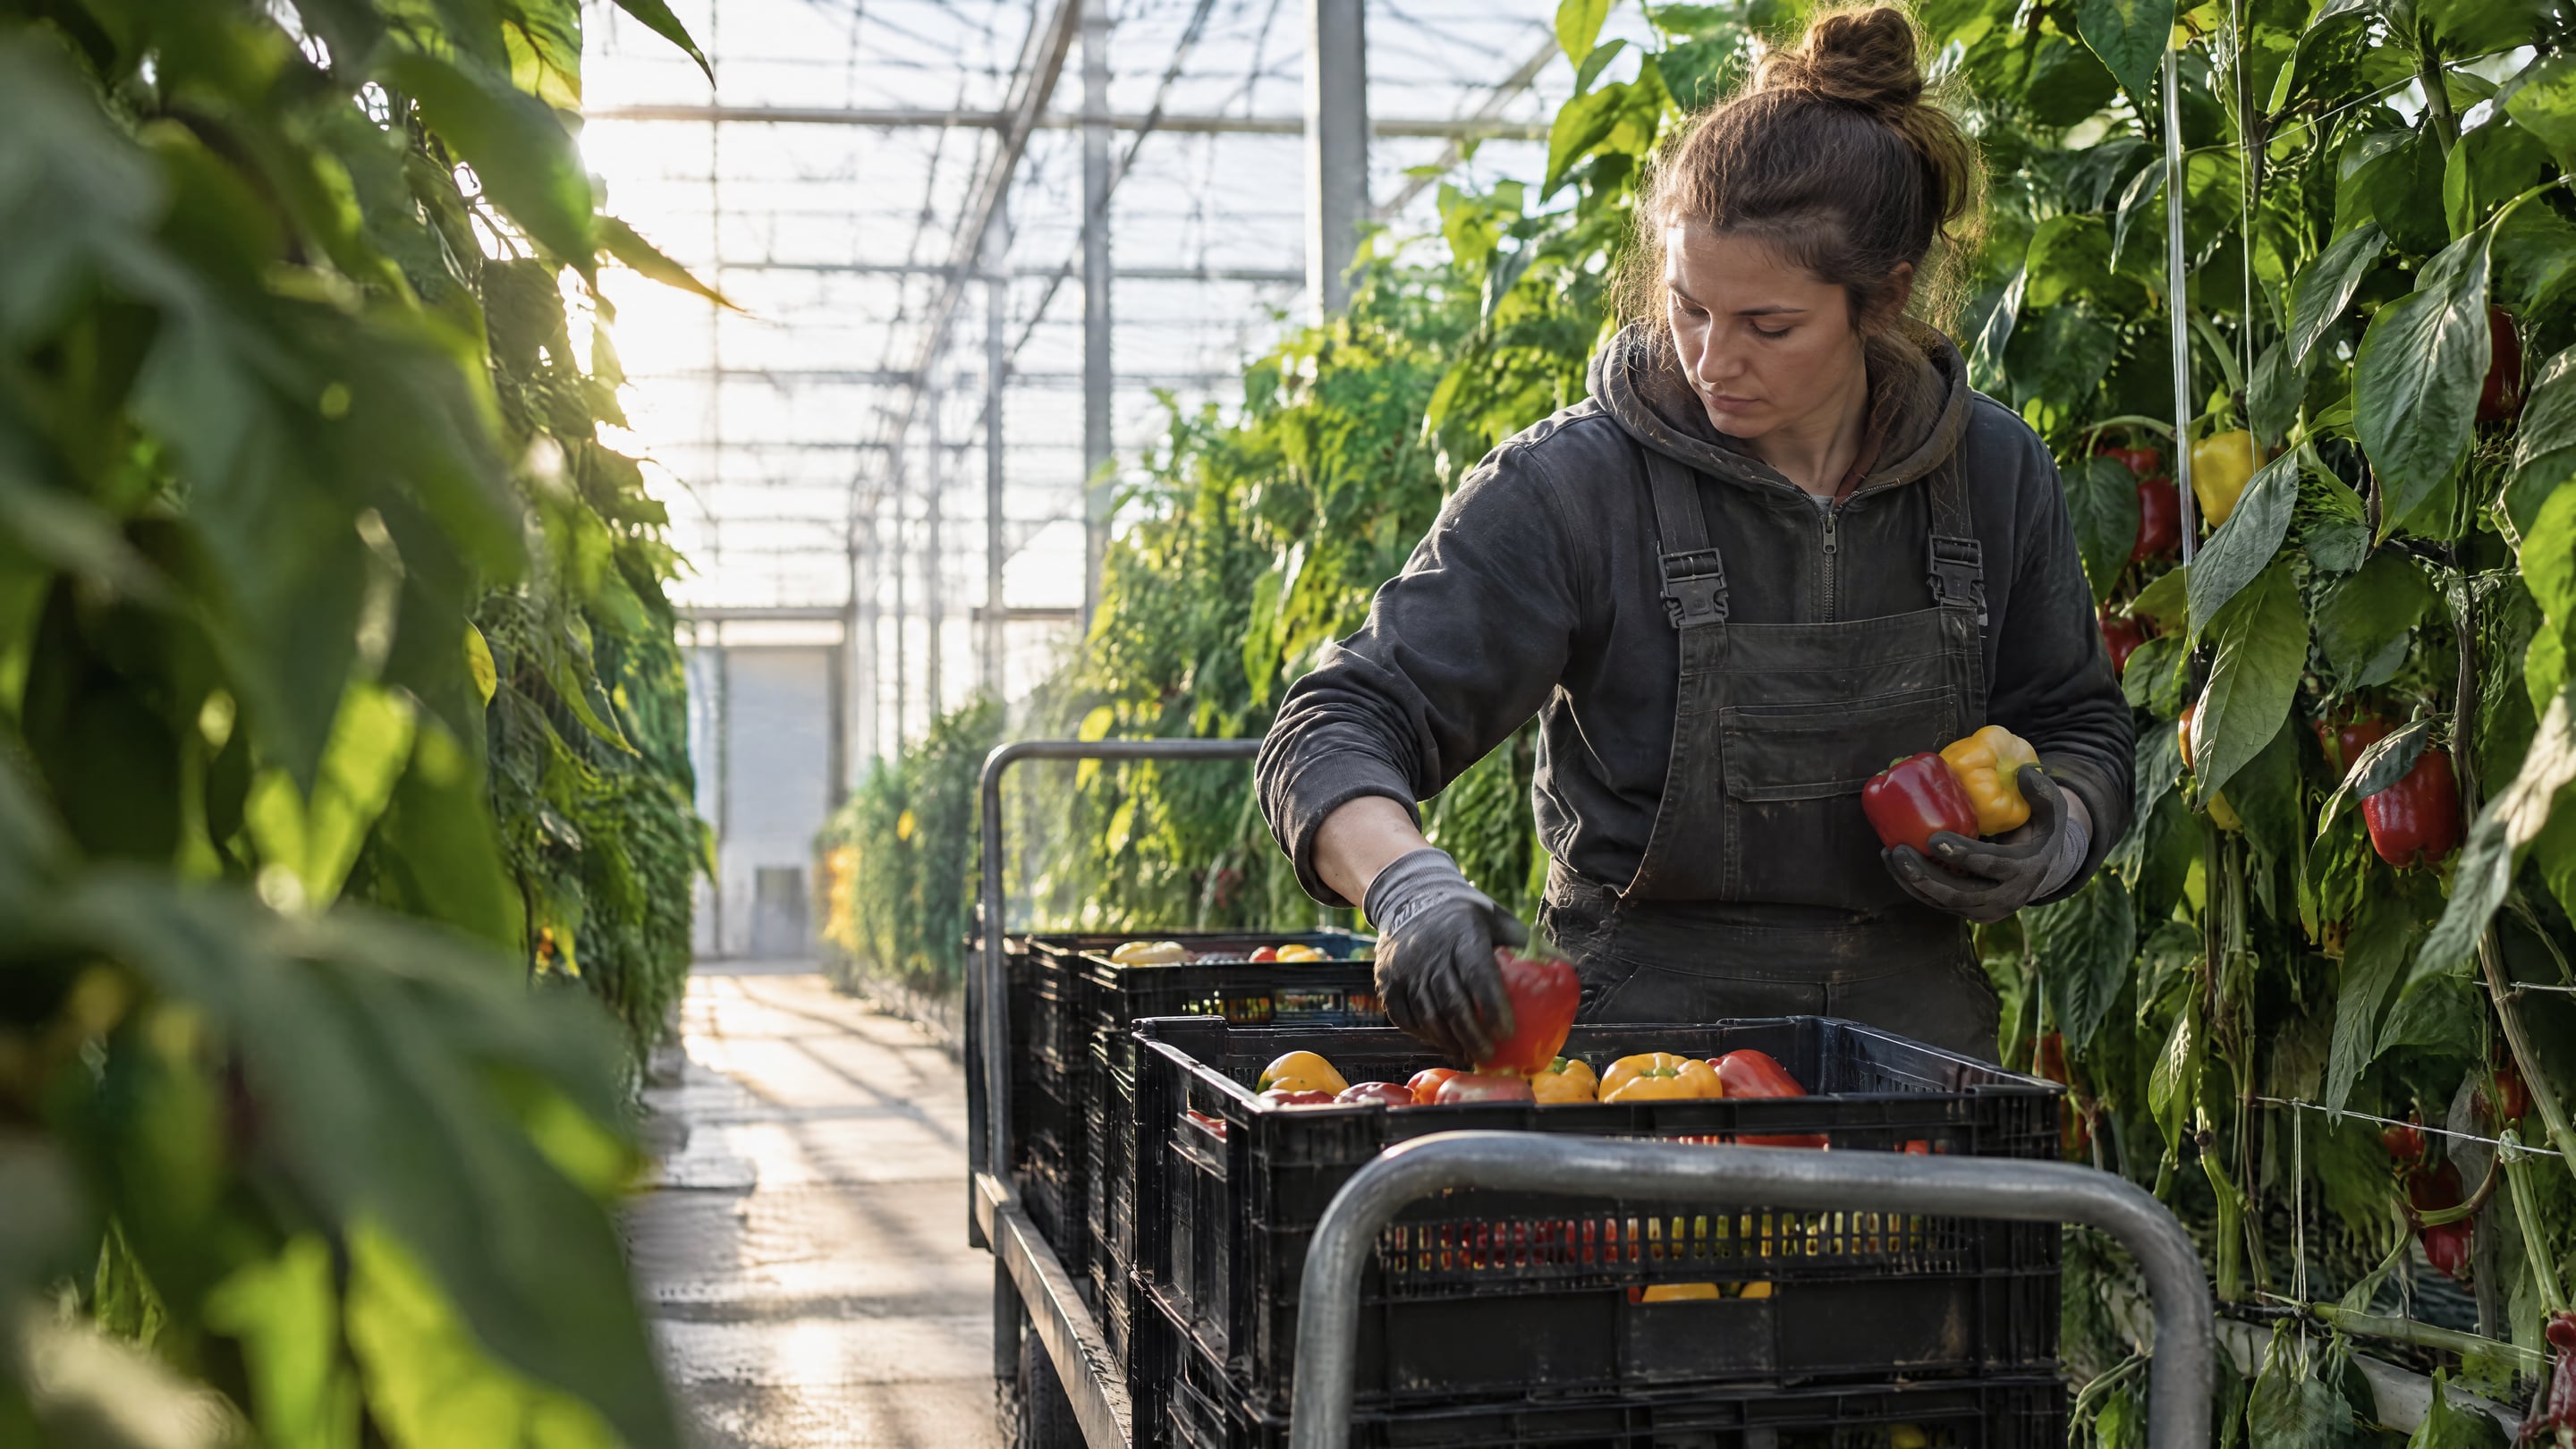
Custody moves to the store or customer. Dwell time starts counting per crate.
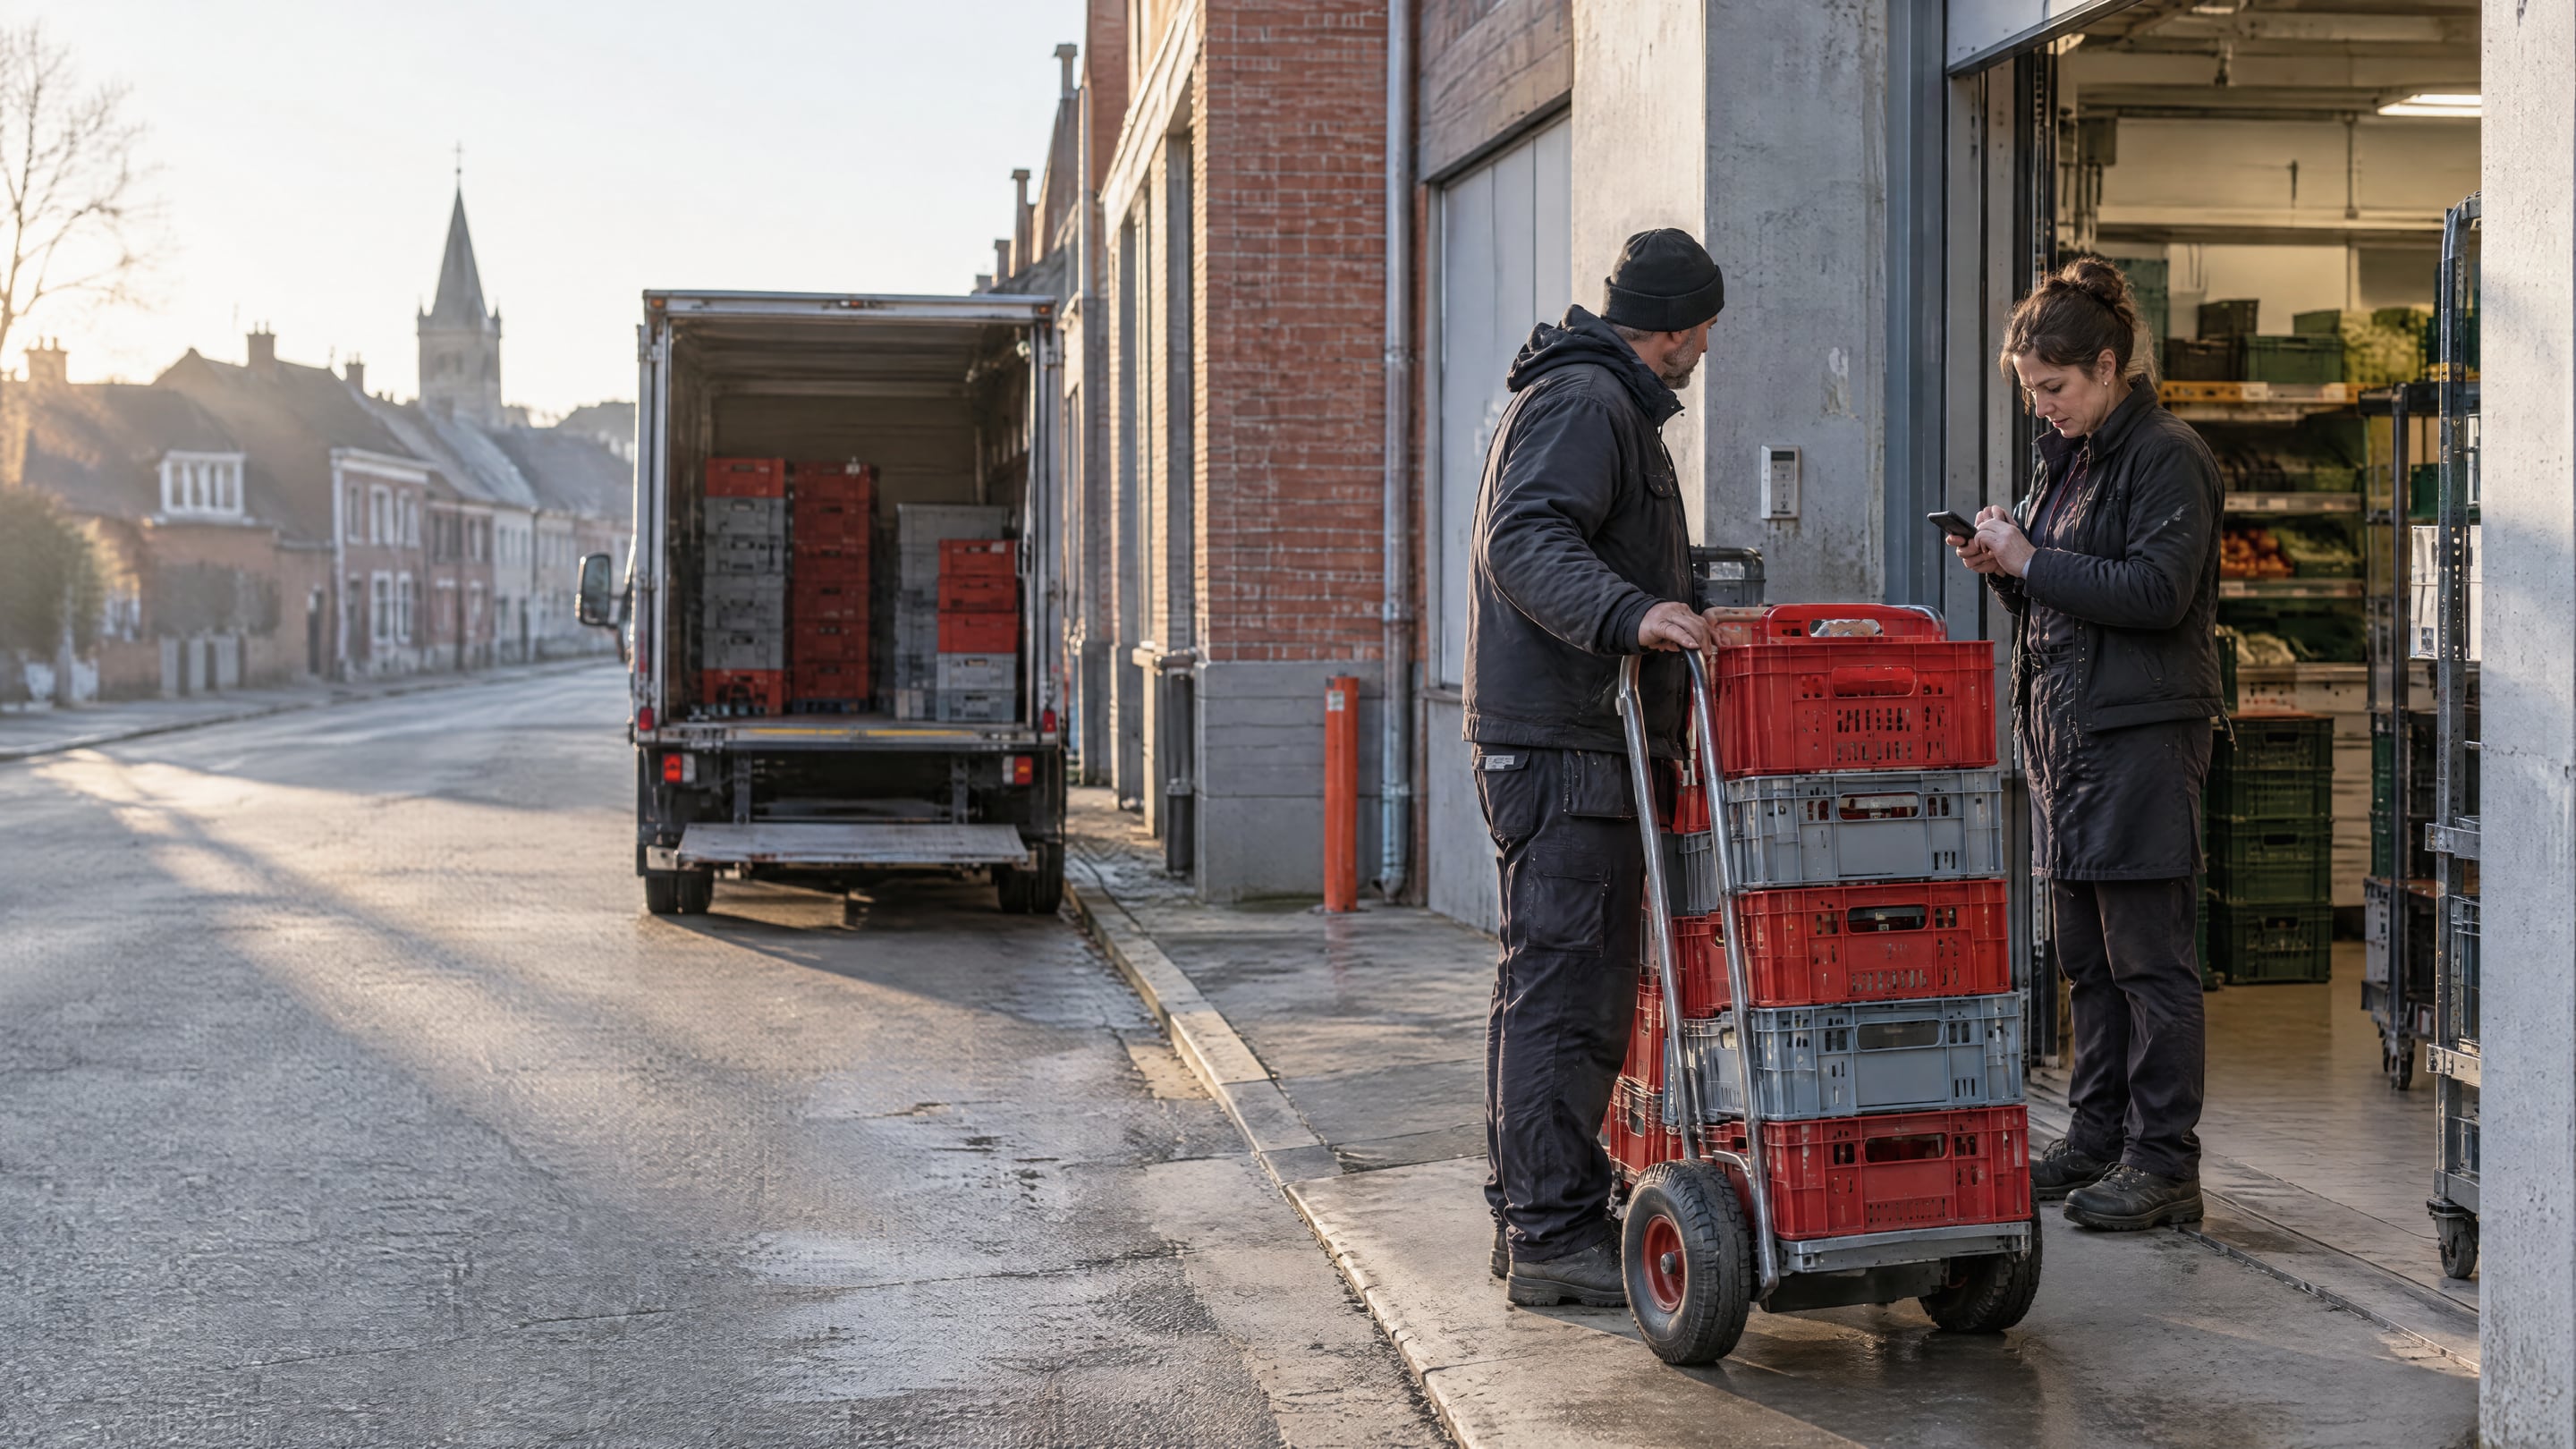
The driver scans empties at pickup. Balances update for both sides at once.
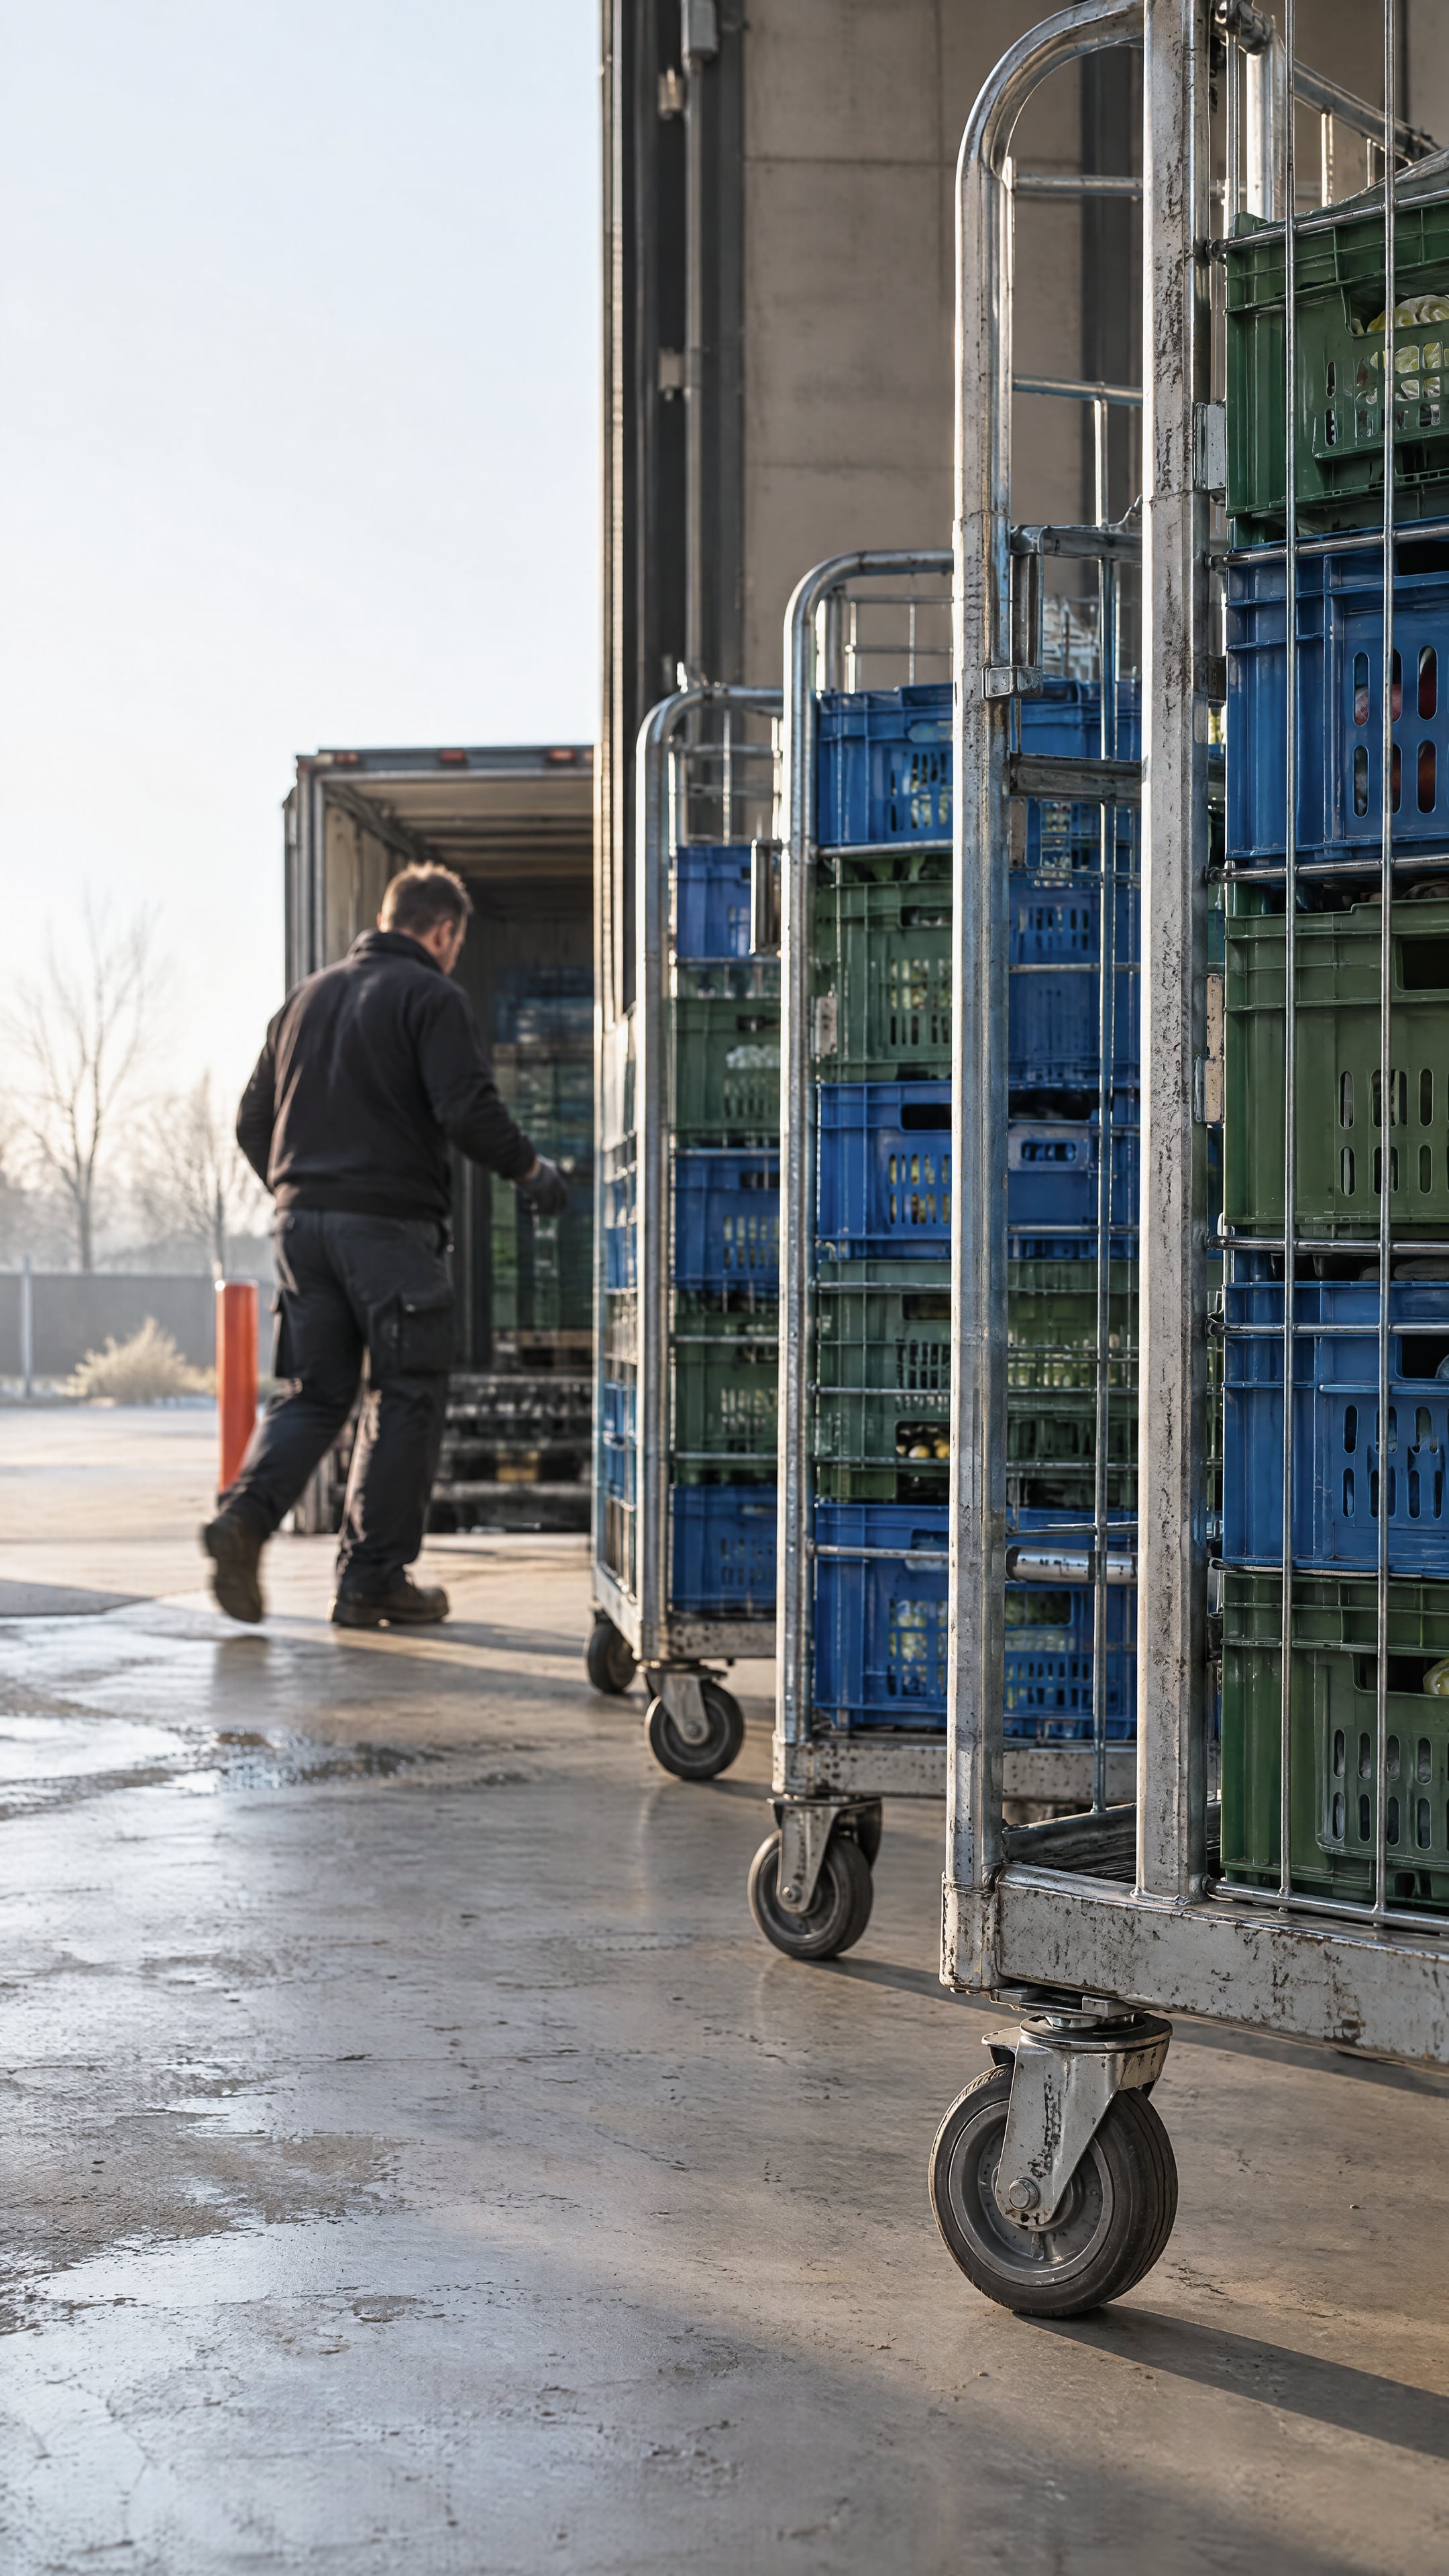
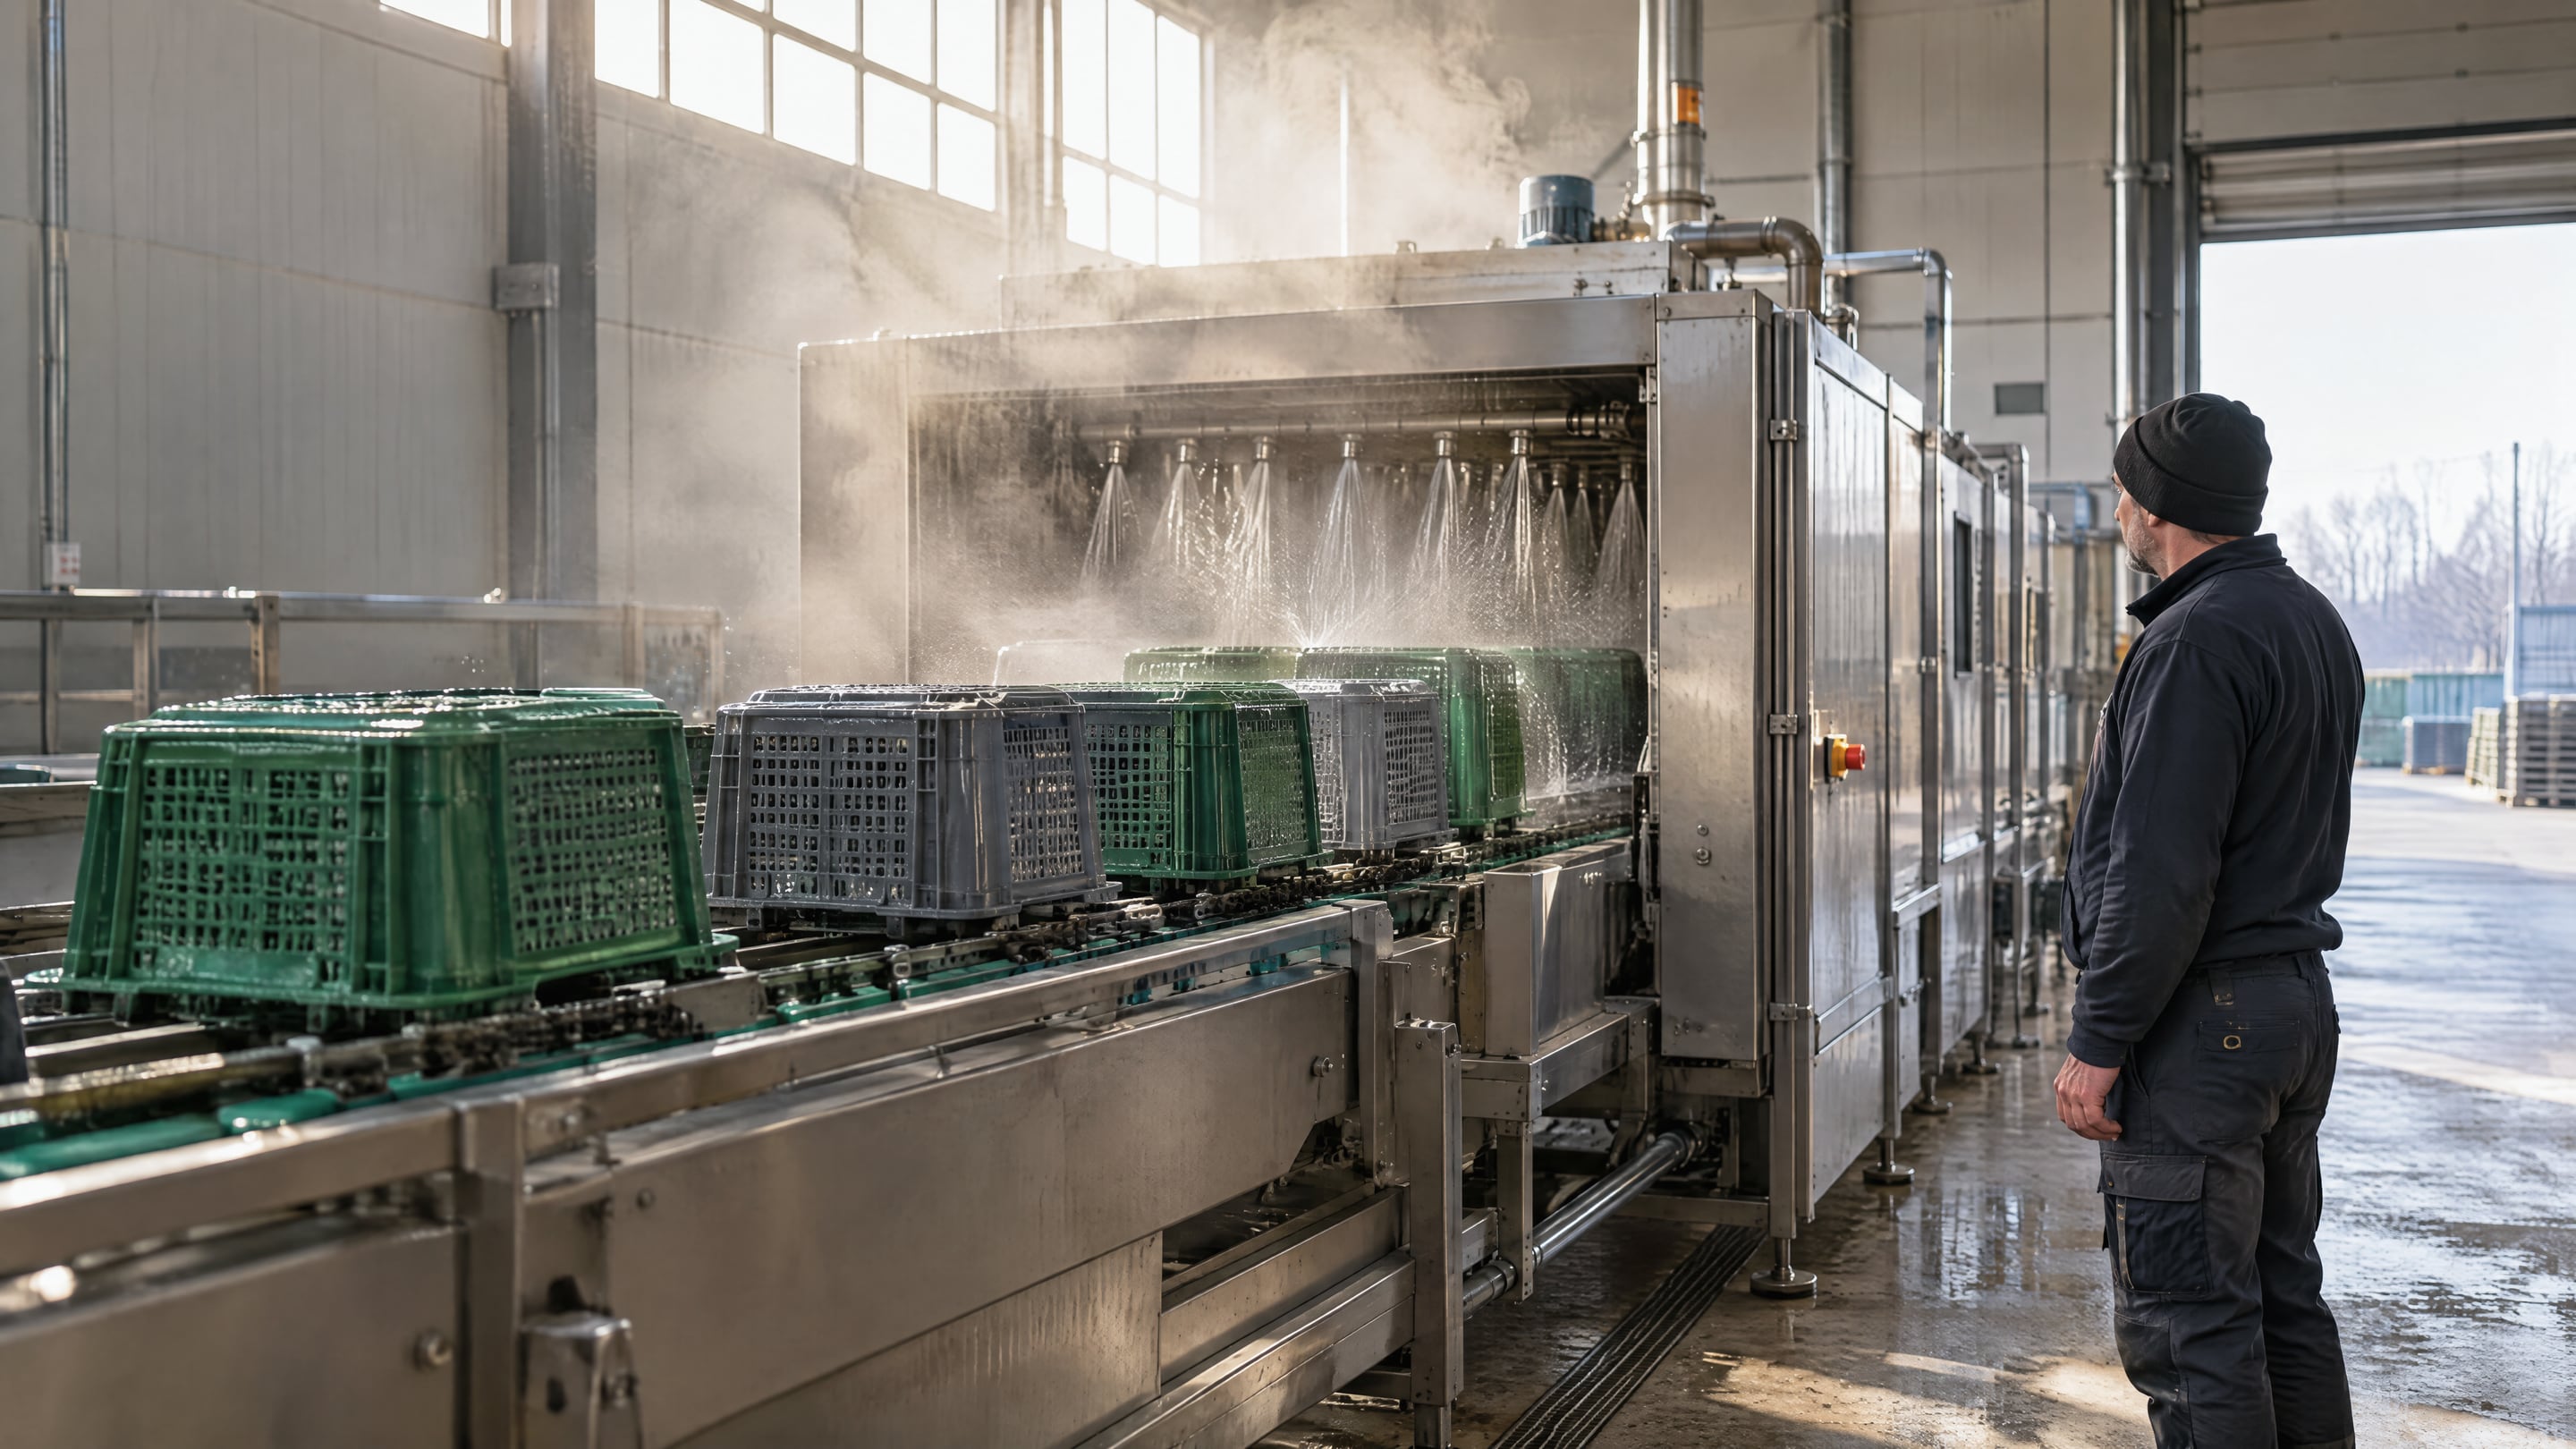
Wash cycles and inspections log per crate, then the crate goes out again.
Every crate has a holder and a place. The pool board shows all of them at once, and which customer is holding on too long.
+ 3 more customers
Groenhal holds 410 crates past 14 days. Proposes a pickup with Thursday’s delivery.
Crates come back in waves, and the wash line has a fixed capacity. Rotion shows the queue before it turns into a shortage at the packing line.
Crates over wash capacity. The queue builds on Thursday.
Thursday returns exceed wash capacity by 1,200 crates. Proposes moving two Thursday pickups to Saturday morning, so the queue stays within one day.
Everything a producer or distributor needs to run a crate pool across customers, depots and wash stations. Pick a feature to see it.
Explore the platform Balance per customerRotation and dwell timeHistory per crateDeposits and settlements Autopilot
| Customer | Out | Back | Open | Dwell |
|---|---|---|---|---|
| Store 2214 Ghent | 1,240 | 1,196 | 44 | 5 d |
| Customer 14 | 860 | 648 | 212 | 21 d |
| DC Zellik | 2,310 | 2,287 | 23 | 2 d |
| Grower Hoogstraten | 1,580 | 1,531 | 49 | 7 d |
| Store 0917 Leuven | 640 | 611 | 29 | 6 d |
Enter your peak week and see how many crates the pool needs, and how many a faster rotation saves. An estimate, not a quote.
crates fewer with a cycle two days shorter
crates at the current loss rate
Estimate based on your inputs and a 10% buffer. Rotion measures your real cycle time per customer.
Field results from operators running Rotion across pools, retail and industry.














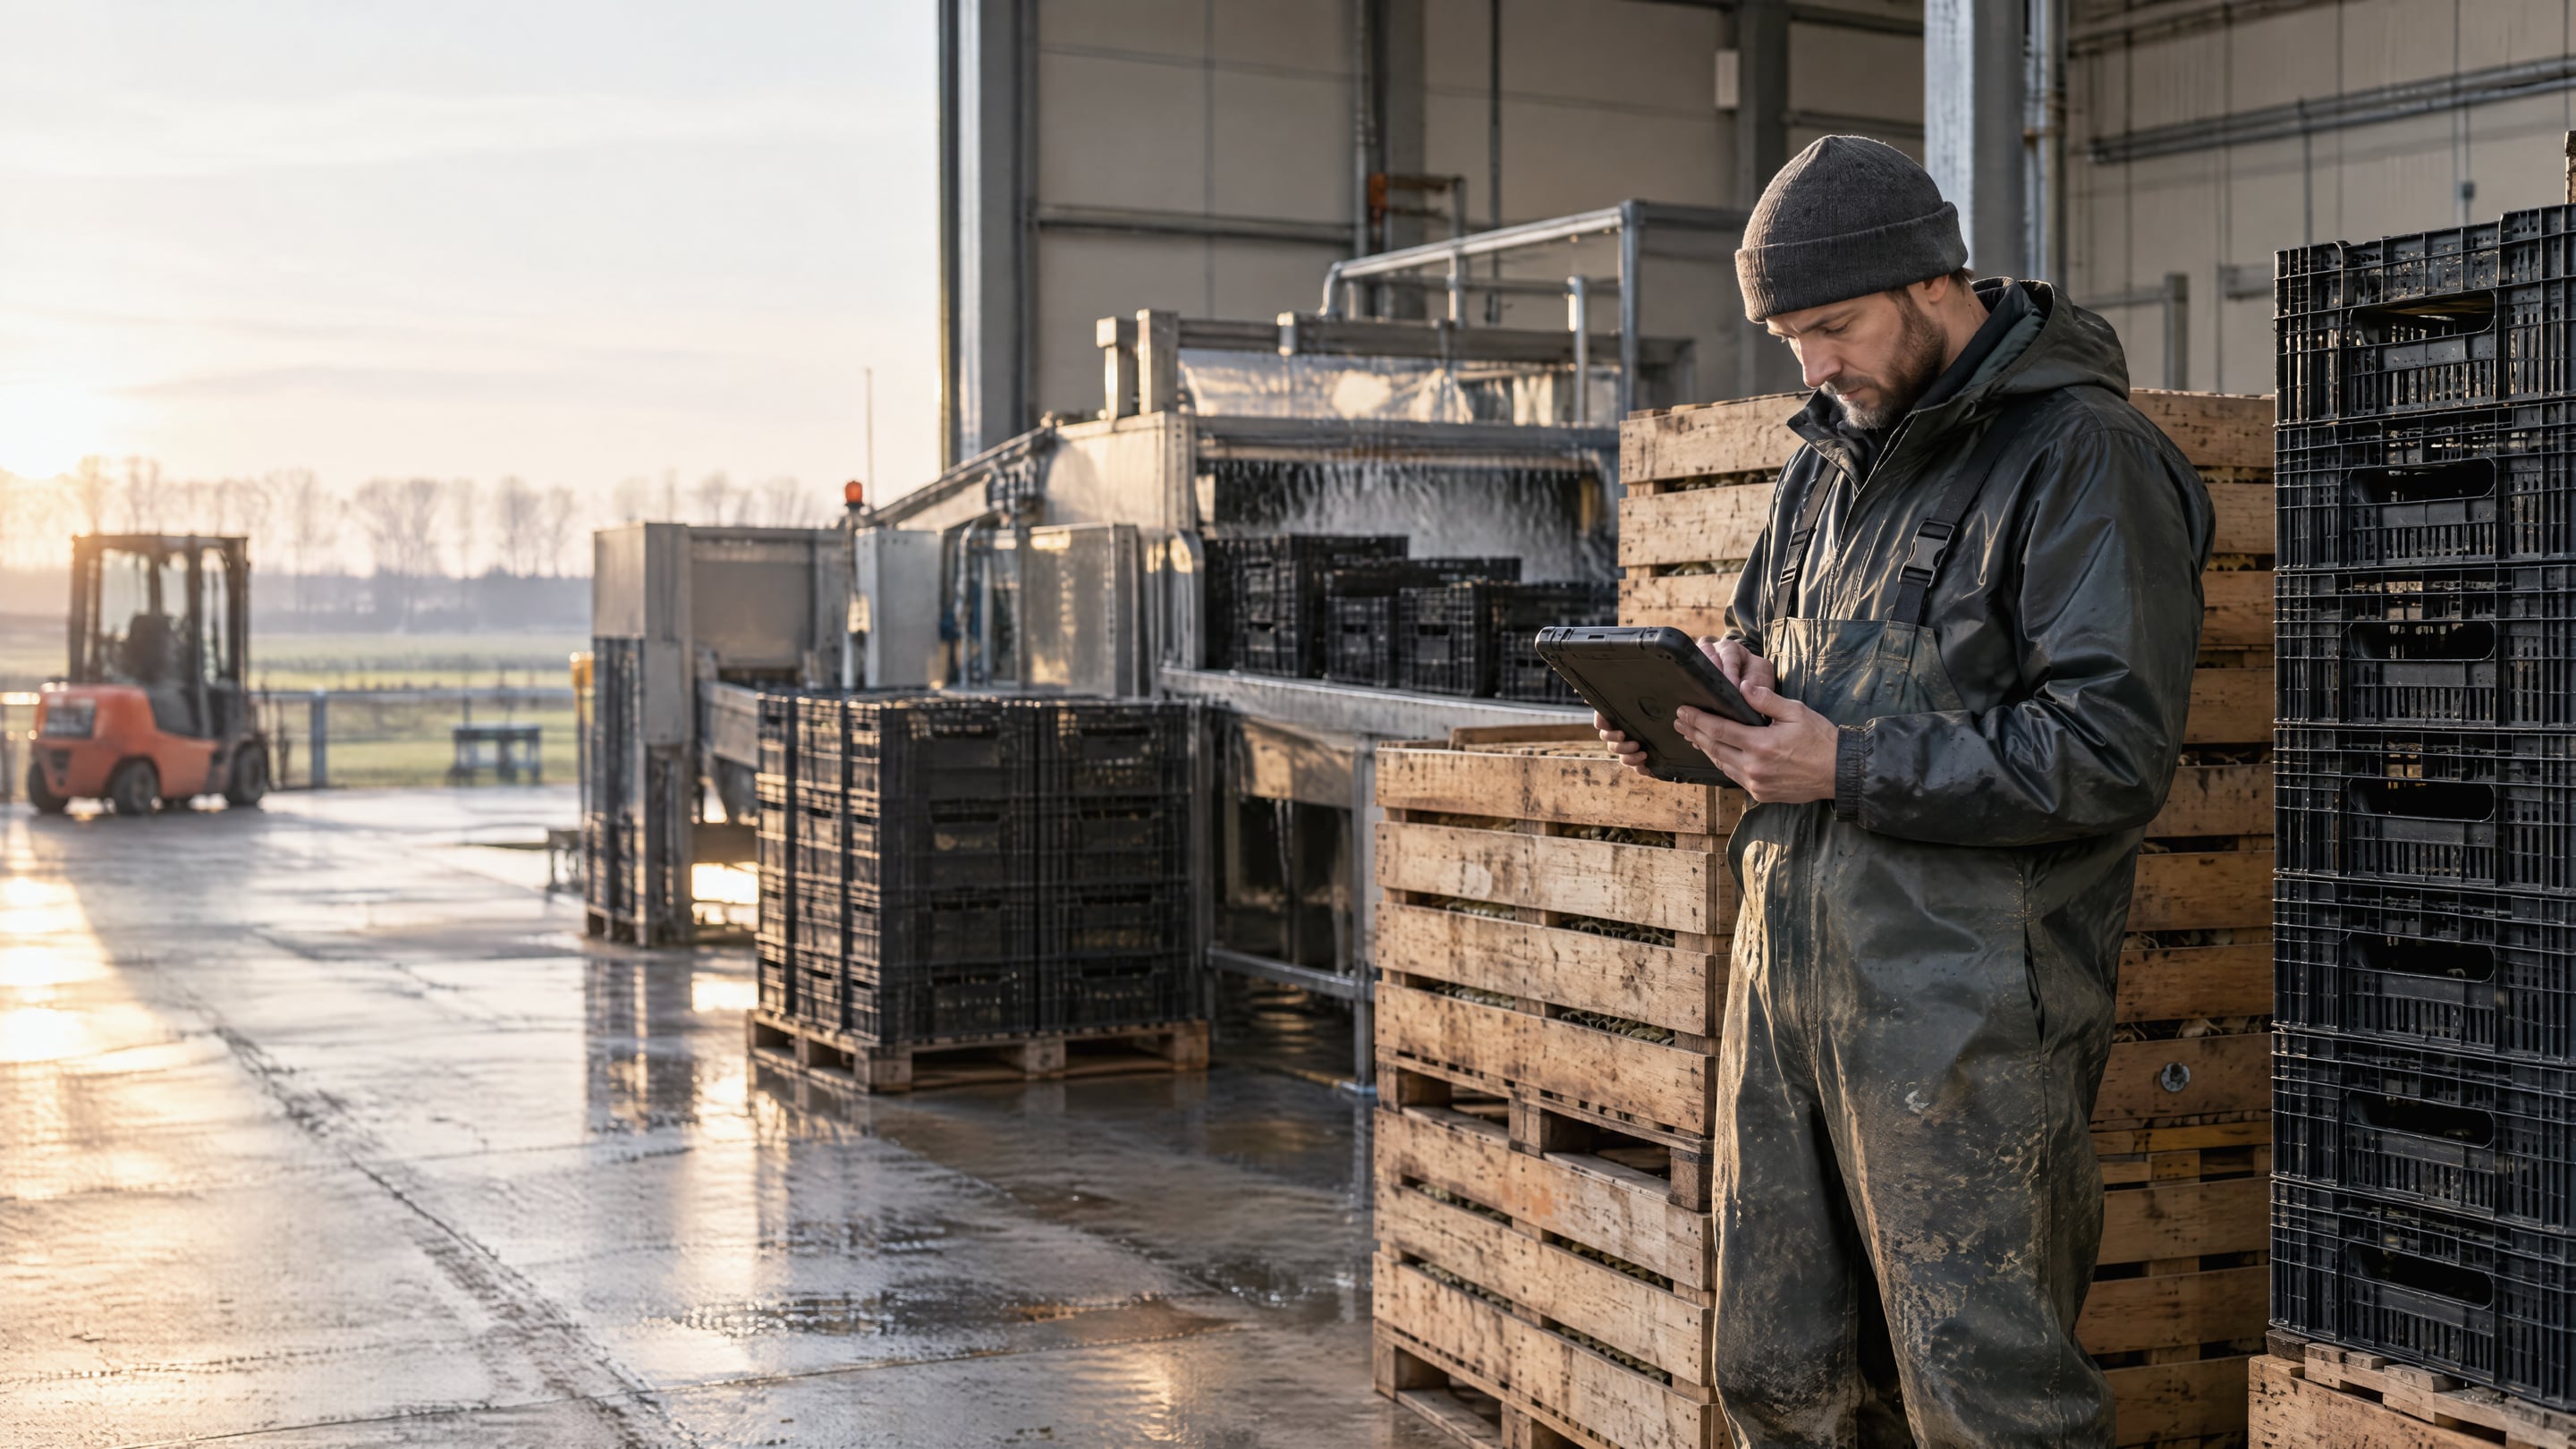
Cycle data shows where crates queue, when wash capacity limits delivery, and which flows starve the loop.
Growers, packers and retail peak in the same weeks. With rotation history, you plan the peak around the crates you already own.
Scan-based balances keep you and each customer looking at the same number all season.
No. Rotion runs alongside your ERP and route planning and fills what they do not cover: crate-level history, loss patterns and per-customer balances. Connectors exist for SAP, Odoo, WMS and TMS.
No. Customers can confirm handovers on the web or a phone, and drivers can scan for them. Adoption does not depend on every customer cooperating.
No. With SSCC batching, a stack or pallet of crates scans once per handling step while each crate stays traceable.
Yes. Rotion reads QR codes, barcodes, RFID and GS1 GRAI identifiers, so relabeling is usually not needed.
Every crate has a holder and a location at all times. Autopilot flags customers holding crates too long and proposes a pickup or reminder, so recovery happens before a write-off. Operators running Rotion report 28% fewer assets lost.
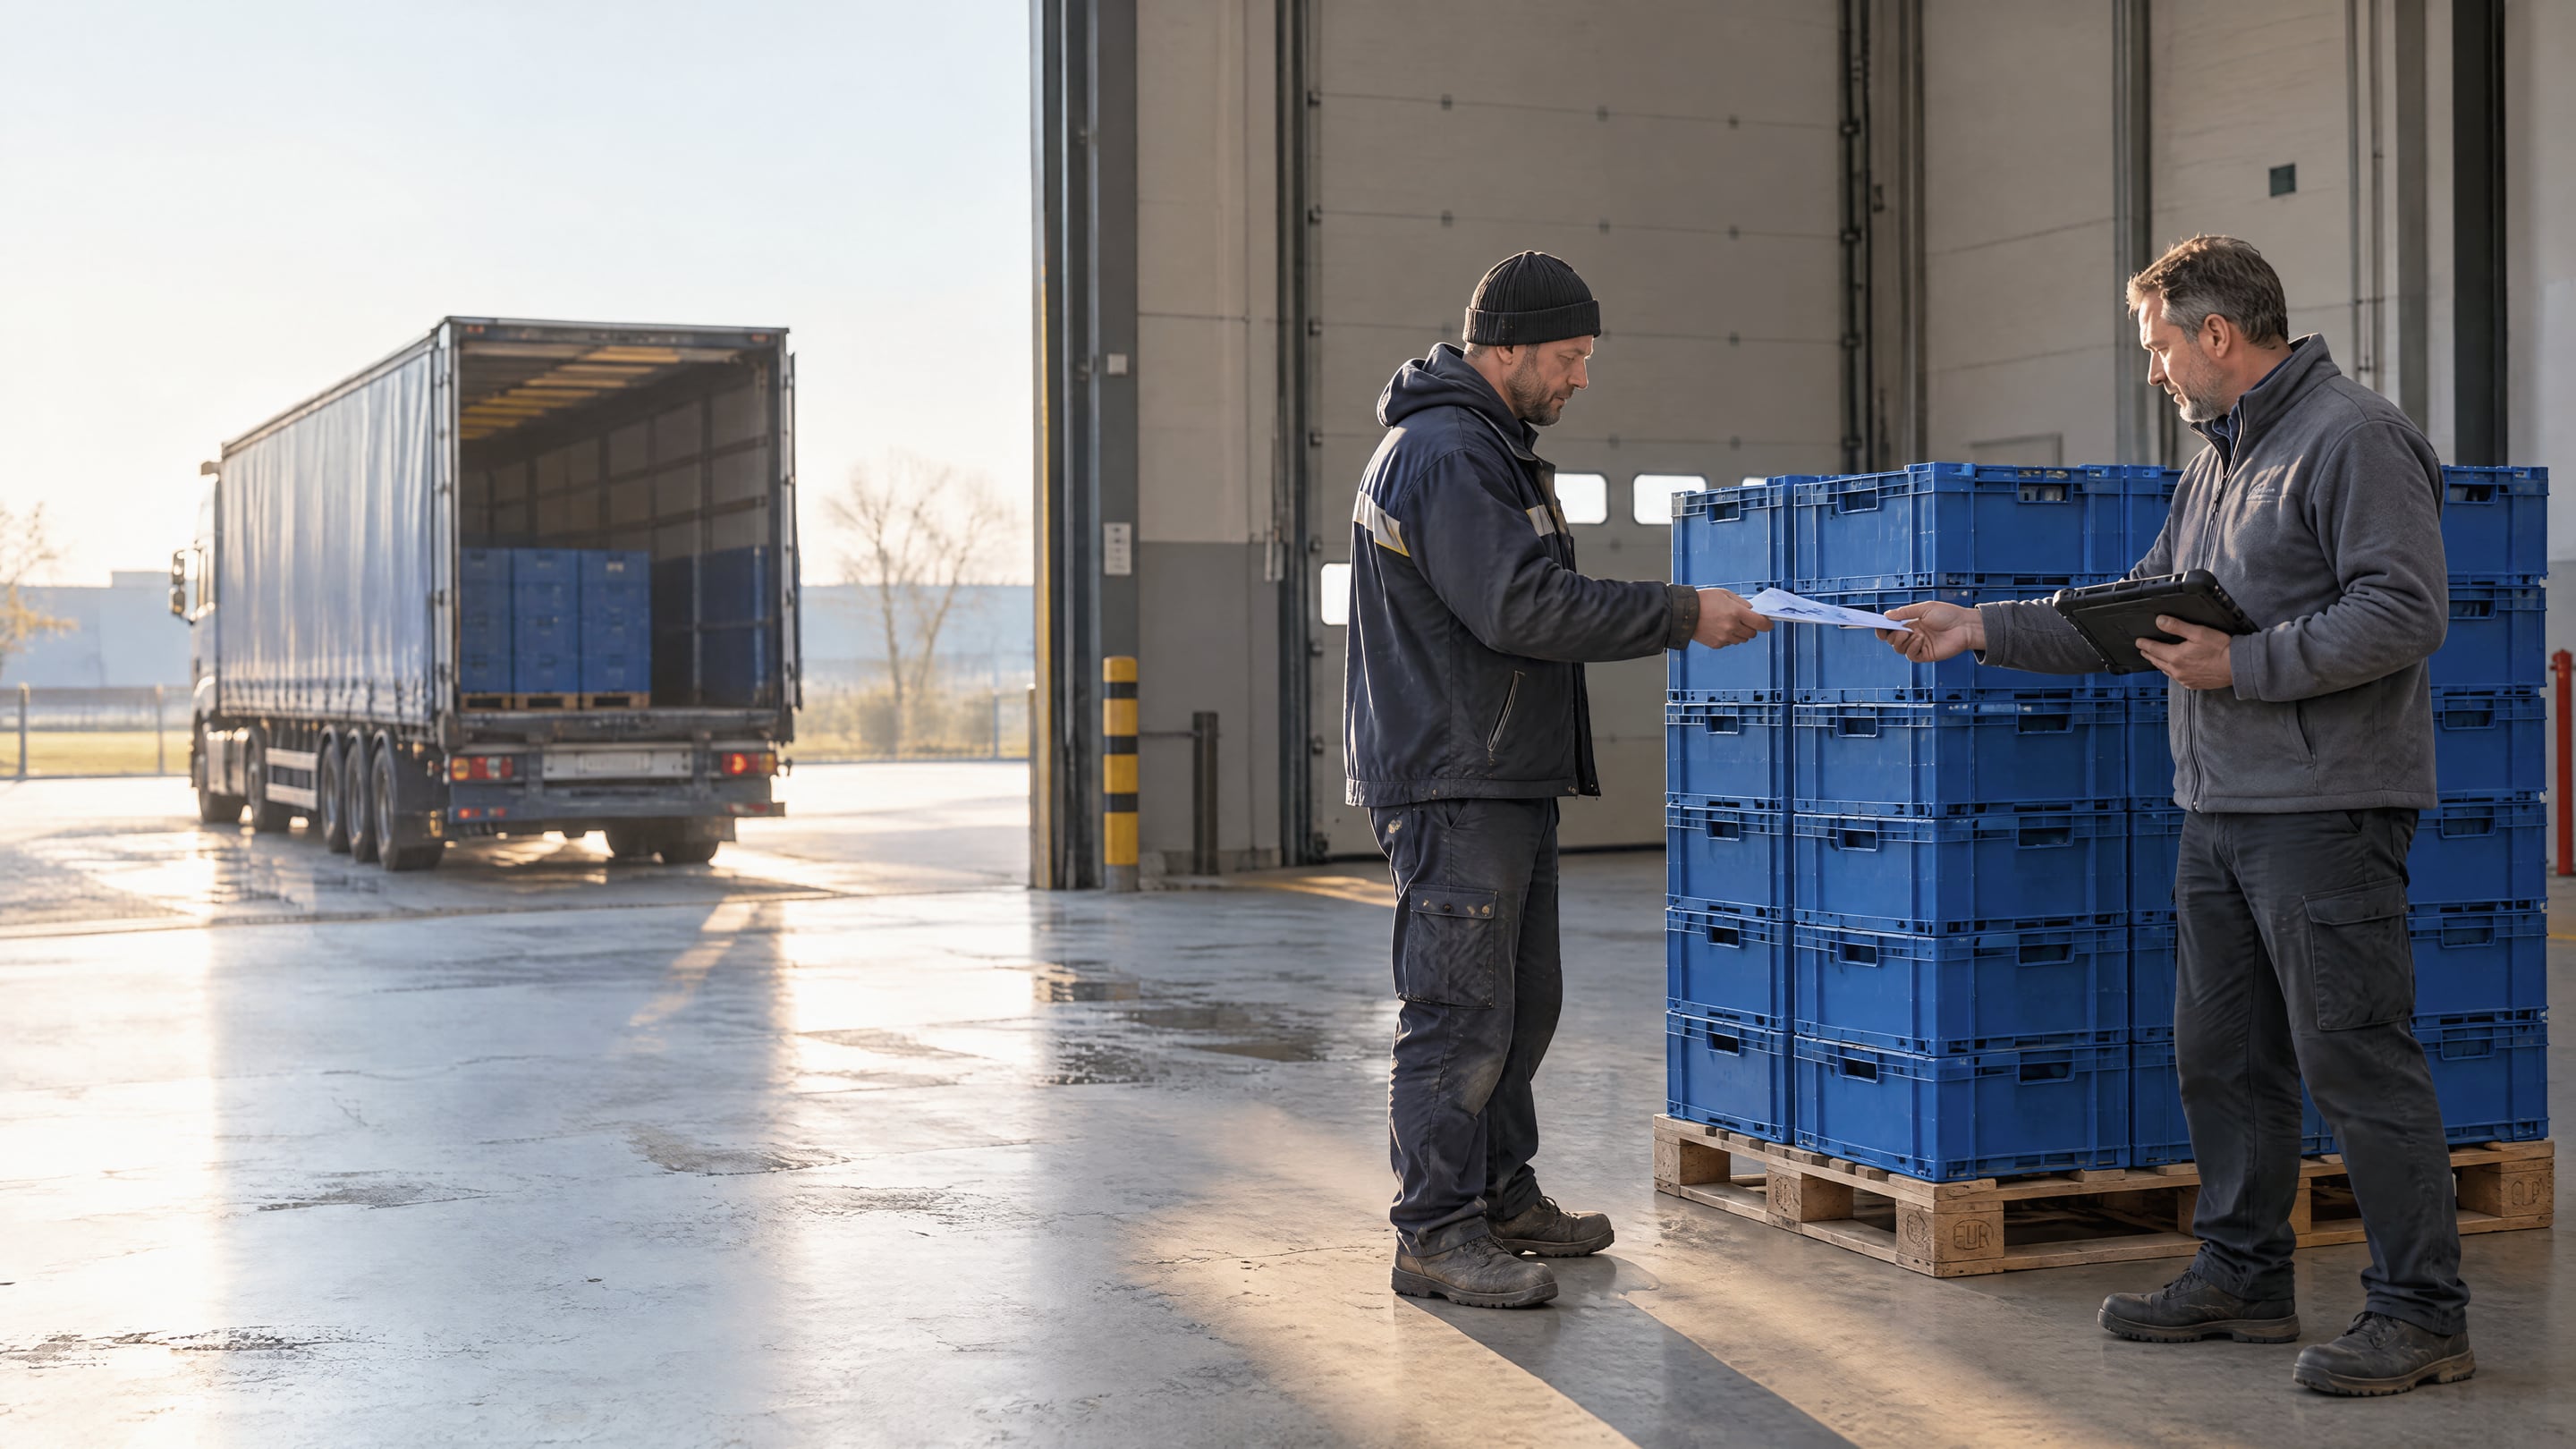 IMG 052 · DC Zellik · 50.8889N 4.2725E
Most teams go live in weeks, on the codes already on their fleet.
AI assistant · answers about Rotion
Hi. Ask me anything about Rotion: how it tracks crates, pallets, kegs and IBCs across partners, what Autopilot does, pricing, or PPWR.