
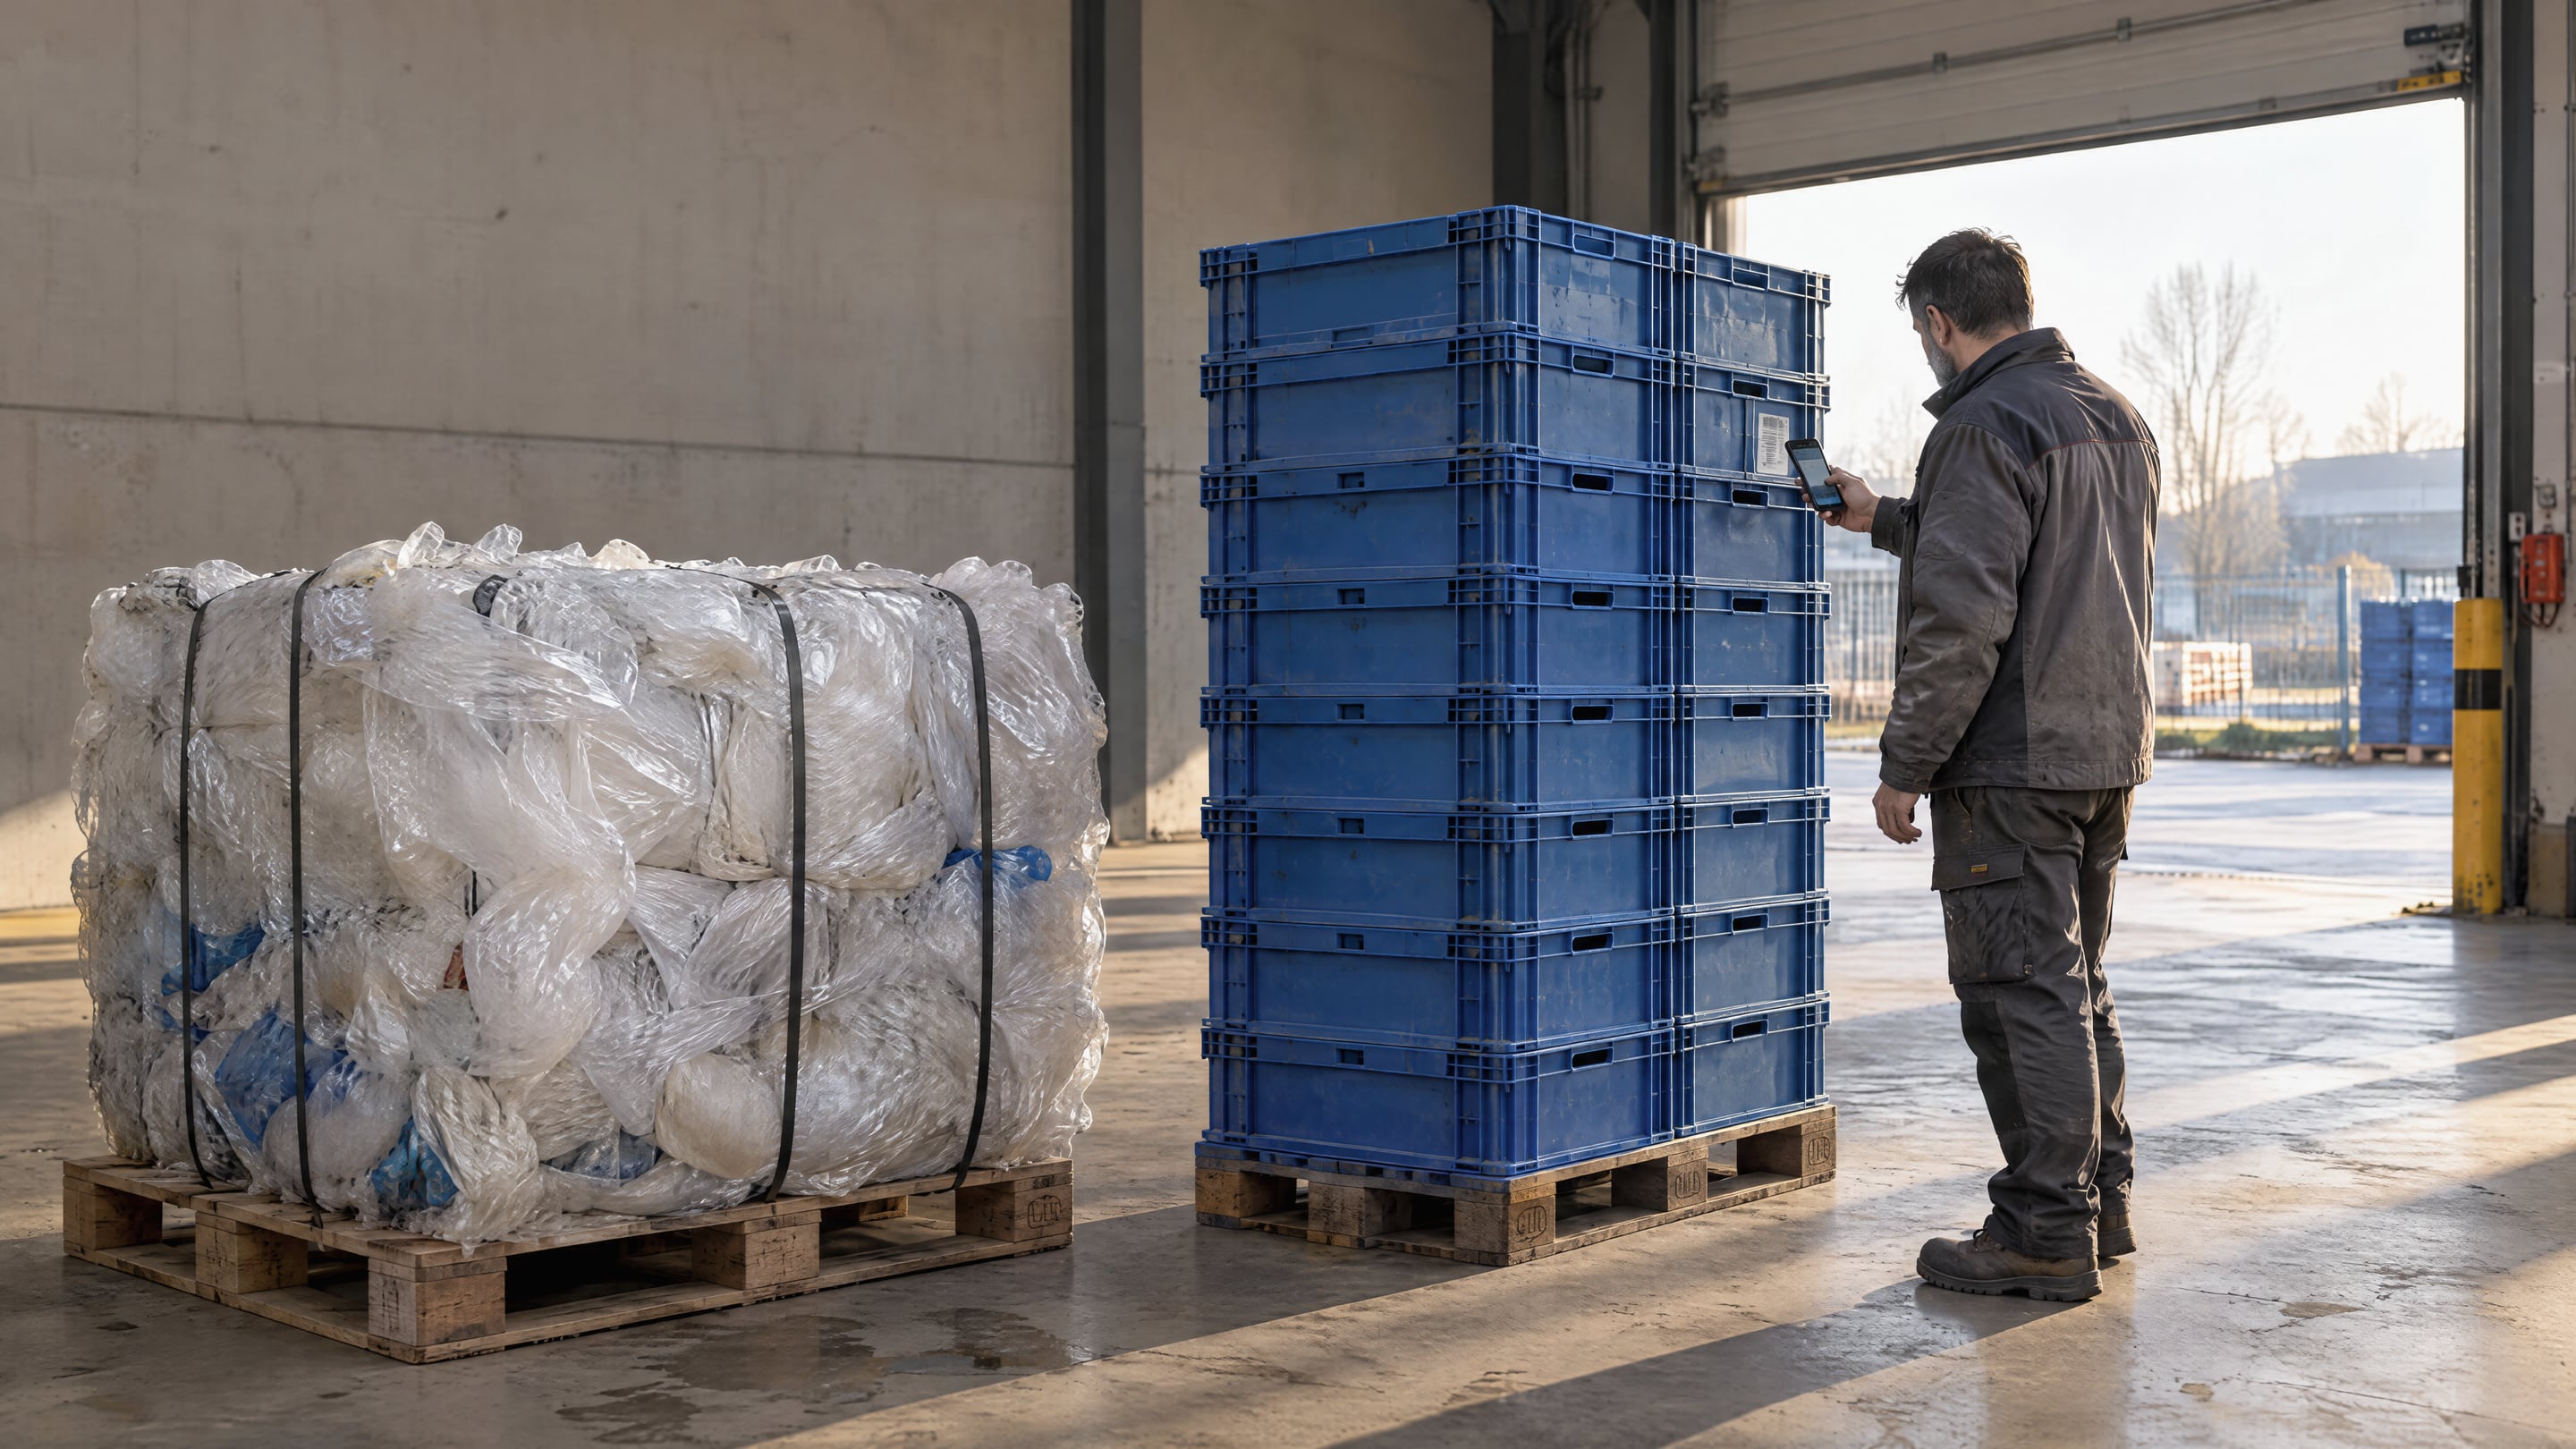
Short answer: Companies reduce plastic packaging waste most by moving single-use transport and consumer packaging into reusable packaging that circulates in a managed loop, and by removing or lightweighting what cannot be reused. Switching materials and adding recycled content change what the waste is made of, not how much of it there is. Book a 20 minute walkthrough of a reuse loop.
In 2023 the EU generated 79.7 million tonnes of packaging waste, 177.8 kg per inhabitant. Plastic was 15.8 million tonnes of it, a fifth of the total (Eurostat, packaging waste statistics, data extracted 10 October 2025, read 22 October 2026). Per person that is 35.3 kg of plastic packaging waste a year, of which 14.8 kg was recycled, a plastic packaging recycling rate of 42.1% (Eurostat news, 22 October 2025). For a company, the share it controls directly is mostly transport and secondary packaging: stretch film, shrink hoods, strapping, single-use trays, bags and boxes that exist only to move goods between two sites. That is also the packaging that is easiest to replace, because the same two sites see it every week.
At a glance: 6 strategies ranked by impact
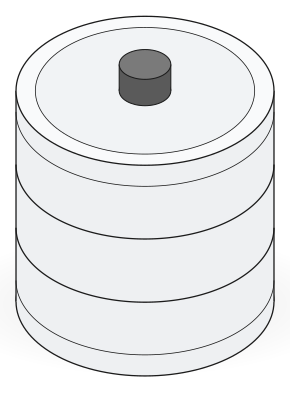
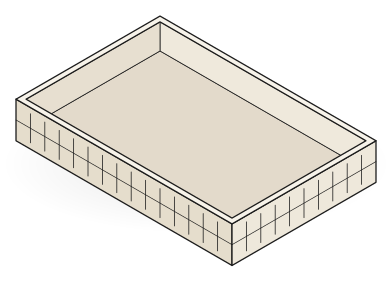
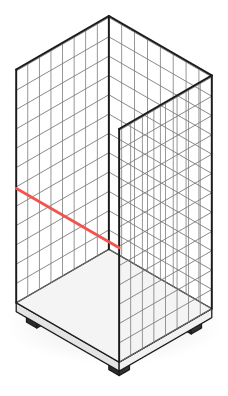
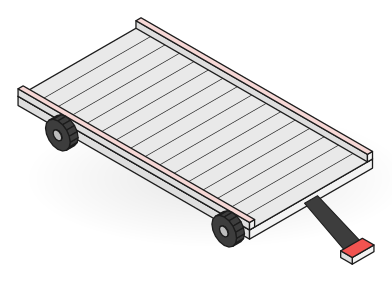
- Reusable packaging loops: replace single-use crates, trays, totes, pails and drums with returnable packaging that completes many cycles. The largest effect, and it grows with every cycle.
- Deposits and return rules: keep the loop closed so reusable packaging comes back instead of becoming waste at a partner’s site.
- Eliminate and lightweight: remove layers nobody needs and cut the mass of what stays.
- Measure per flow, not per bin: count packaging per shipment type and partner, so the first three can be proven and reported.
- Recycled content: lowers virgin plastic, leaves the waste volume unchanged.
- Material switch: moves the waste from plastic to paper or wood, often with more mass, not less.
Where does a company’s plastic packaging waste come from?
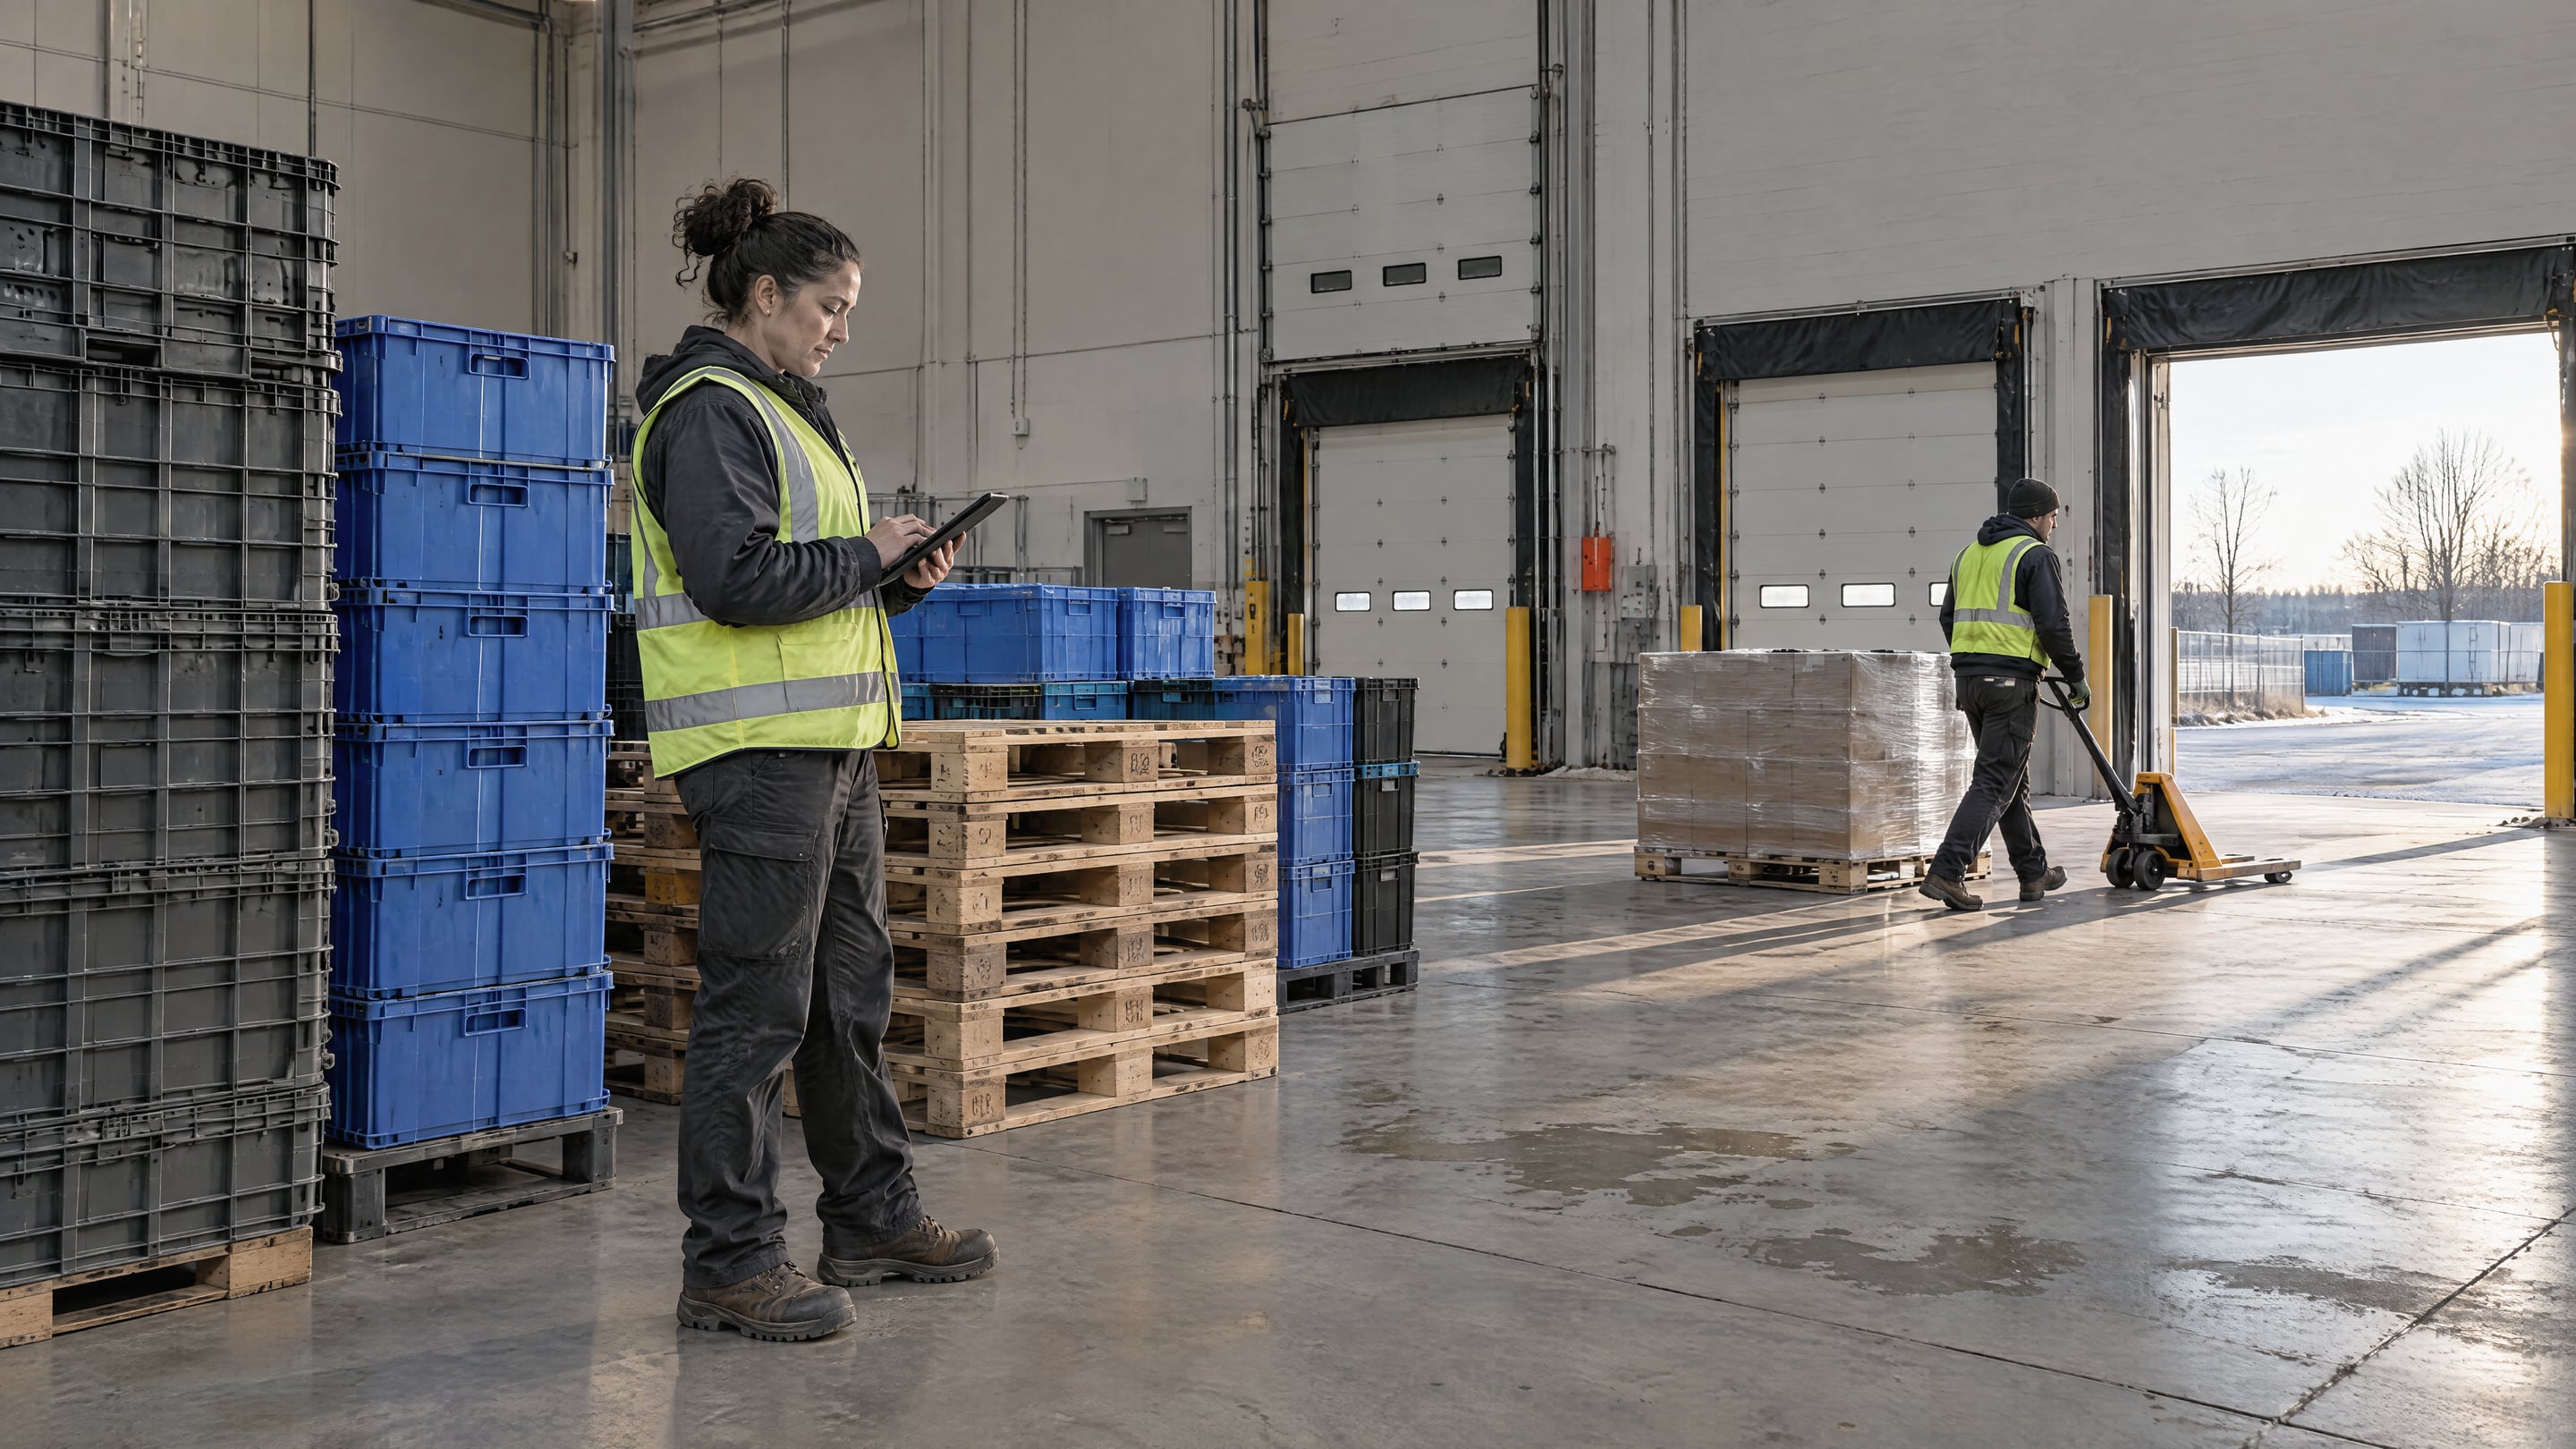
Most of a company’s plastic packaging waste comes from transport and grouped packaging, not from the sales packaging the consumer sees. Pallet wrap, shrink hoods, strapping, single-use plastic trays and crates, and bags inside cartons are used once between two sites and thrown away at arrival. That is the stream a company controls on its own.
A useful audit works by flow rather than by waste bin. List every shipment type between your sites and your partners: supplier to plant, plant to distribution center, distribution center to store or customer, and the returns. For each flow, write down the packaging per unit shipped and multiply by the yearly volume. US readers will know the same items as returnable containers, RPCs, totes and dunnage. The result is a short table of flows ranked by plastic mass per year, and the top three rows usually hold most of the total.
Which strategies reduce plastic packaging waste, and by how much?
Six strategies cover almost everything a company can do about plastic packaging waste. Only three of them reduce the volume of waste: reusable packaging loops, deposits that keep those loops closed, and eliminating or lightweighting packaging. The other three change the material, the origin of the material, or the quality of the data, which matters for the EU Packaging and Packaging Waste Regulation (PPWR) but does not shrink the pile.
| Strategy | Effect on waste volume | Where it works | The catch |
|---|---|---|---|
| Reusable packaging loops | Largest: one reusable item replaces one single-use item per cycle | Transport and grouped packaging between fixed partners, consumer packaging with a return point | Only as good as the return rate; lost items are new waste and new material |
| Deposits and return rules | Protects the reduction the loop delivers | Any loop with more than one partner | Needs a per-item record to settle fairly |
| Eliminate and lightweight | Moderate: removes a layer or a share of the mass | Over-packed products, oversized boxes, double wrapping | Limited by product protection; PPWR also caps empty space |
| Measure per flow | None by itself; makes the others provable | Every company | Requires data at shipment level, not yearly bin weights |
| Recycled content | None: the same mass, different origin | Films, trays, bottles | Required under PPWR for plastic packaging, so it is compliance, not reduction |
| Material switch | Often negative: paper and wood weigh more per unit | Where a fibre alternative protects as well | Changes the material stream and the recycling rate, not the quantity |
Why are reusable packaging loops the biggest lever?
Reusable packaging loops are the biggest lever because the waste reduction compounds with every cycle. A reusable crate that completes 50 trips between a grower and a retailer replaces 50 single-use trays and the film around them. The reduction equals the number of cycles completed multiplied by the single-use mass each cycle avoids, minus the reusable items that are lost or broken along the way.
That arithmetic is also why reusable packaging pays back financially in some contexts and not in others. Lifetime, cycles per year, loss rate and the cost of washing and transport decide both the waste effect and the business case. We walk through those four drivers in Is reusable packaging economically viable in your context?, and the mechanics of a loop in How reusable packaging systems actually work.
A working example at retail scale is Repasys, Belgium’s first large-scale reusable packaging pilot for fresh food. It runs 106,312 reusable packages across 6 retailers with a 0.30 euro deposit per package, and a consumer can return a package at any participating store. Every one of those packages replaces a single-use tray each time it goes around.
What makes a reuse loop fail, and how do you prevent it?
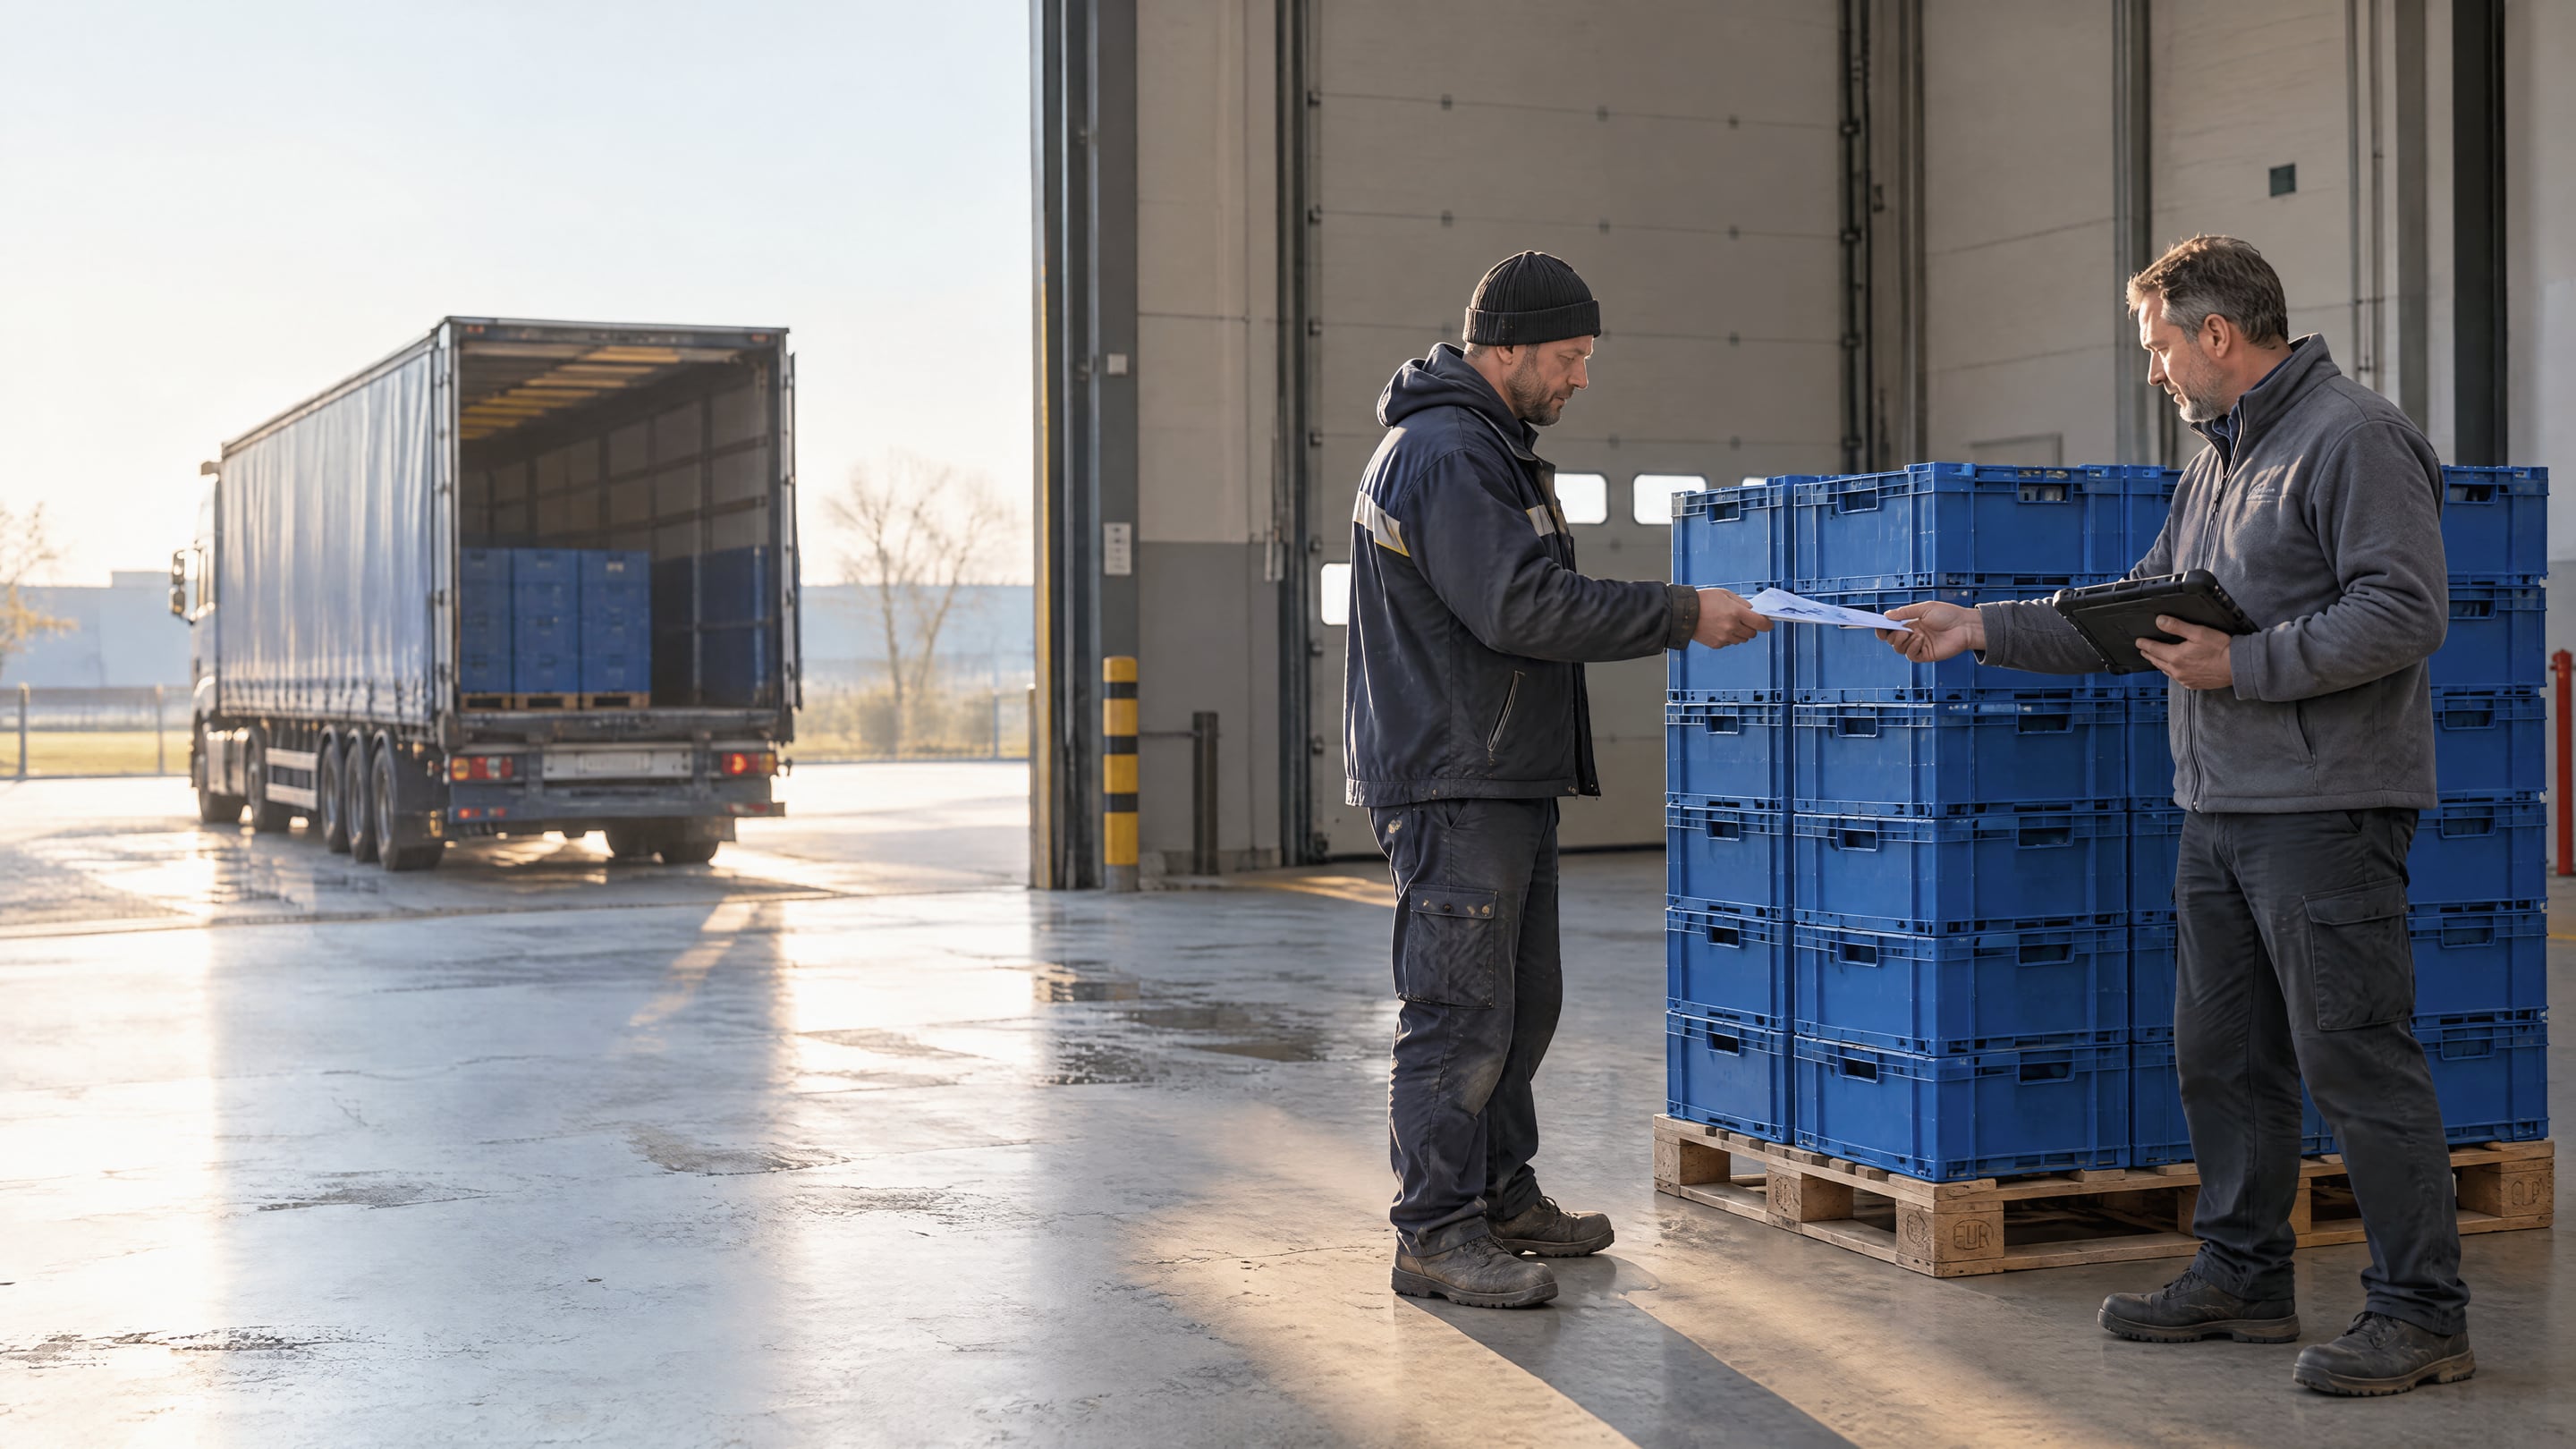
Reuse loops fail when the packaging does not come back. Reusable crates, totes, pallets and drums stay at a partner’s site, get used as storage, leave with a carrier, or are thrown away by someone who does not know they are returnable. Each lost item is a write-off, a replacement purchase and new plastic, so the loss rate decides whether a reuse loop reduces waste or merely moves it.
Preventing that is an operations and data problem, not a packaging design problem. Four things keep a loop closed:
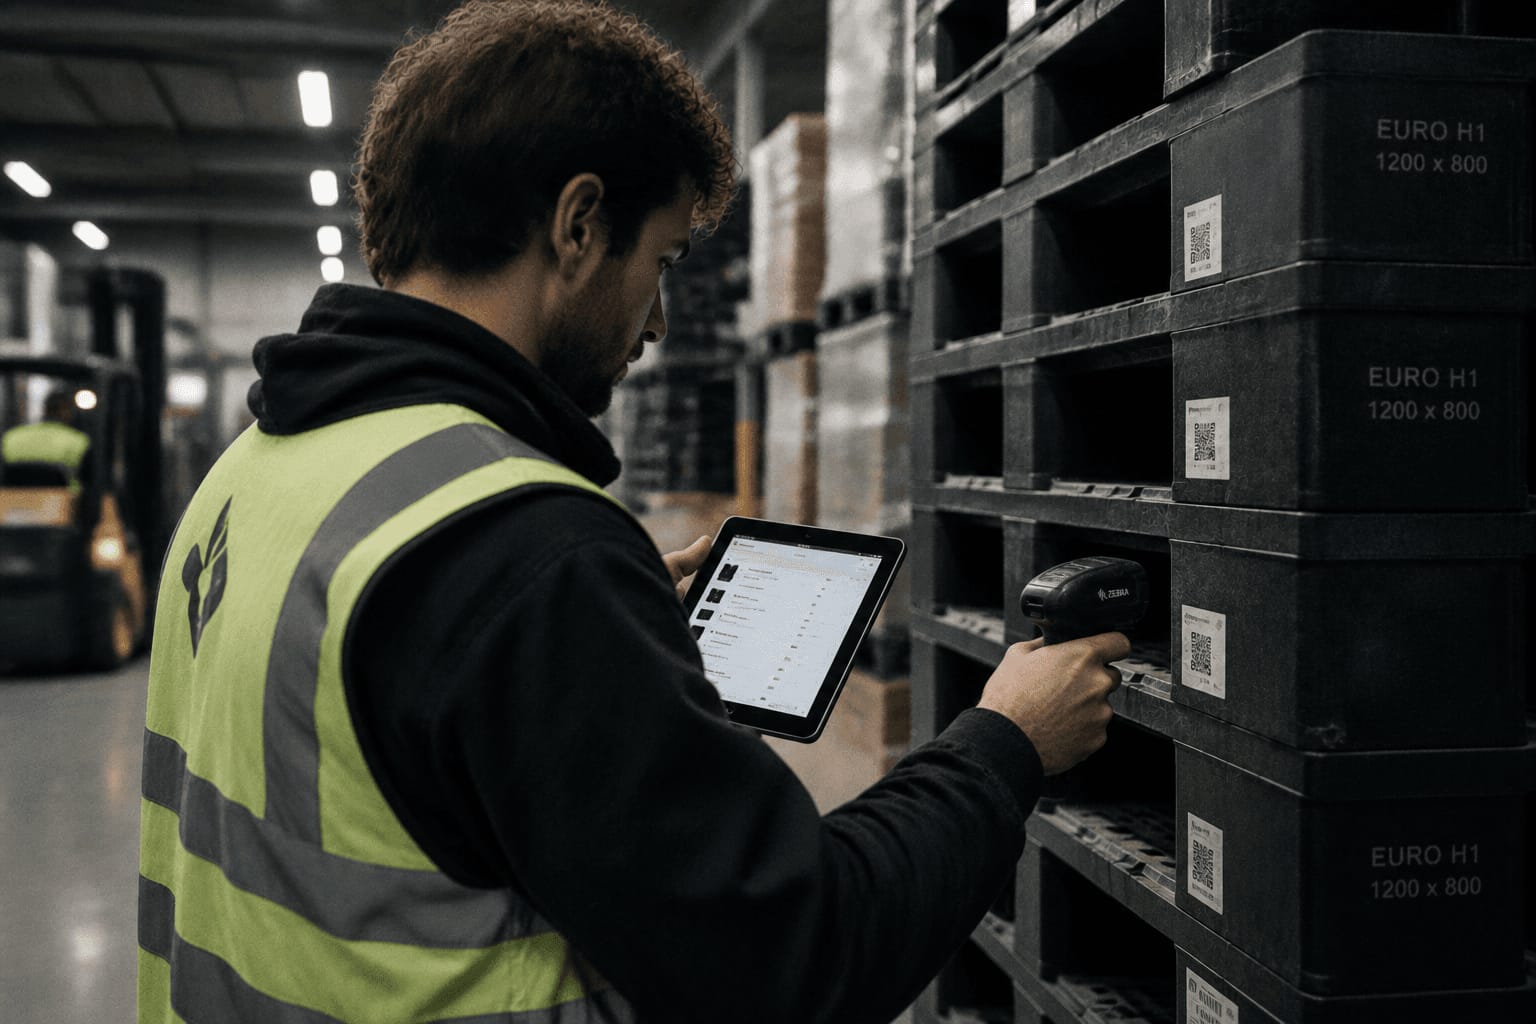
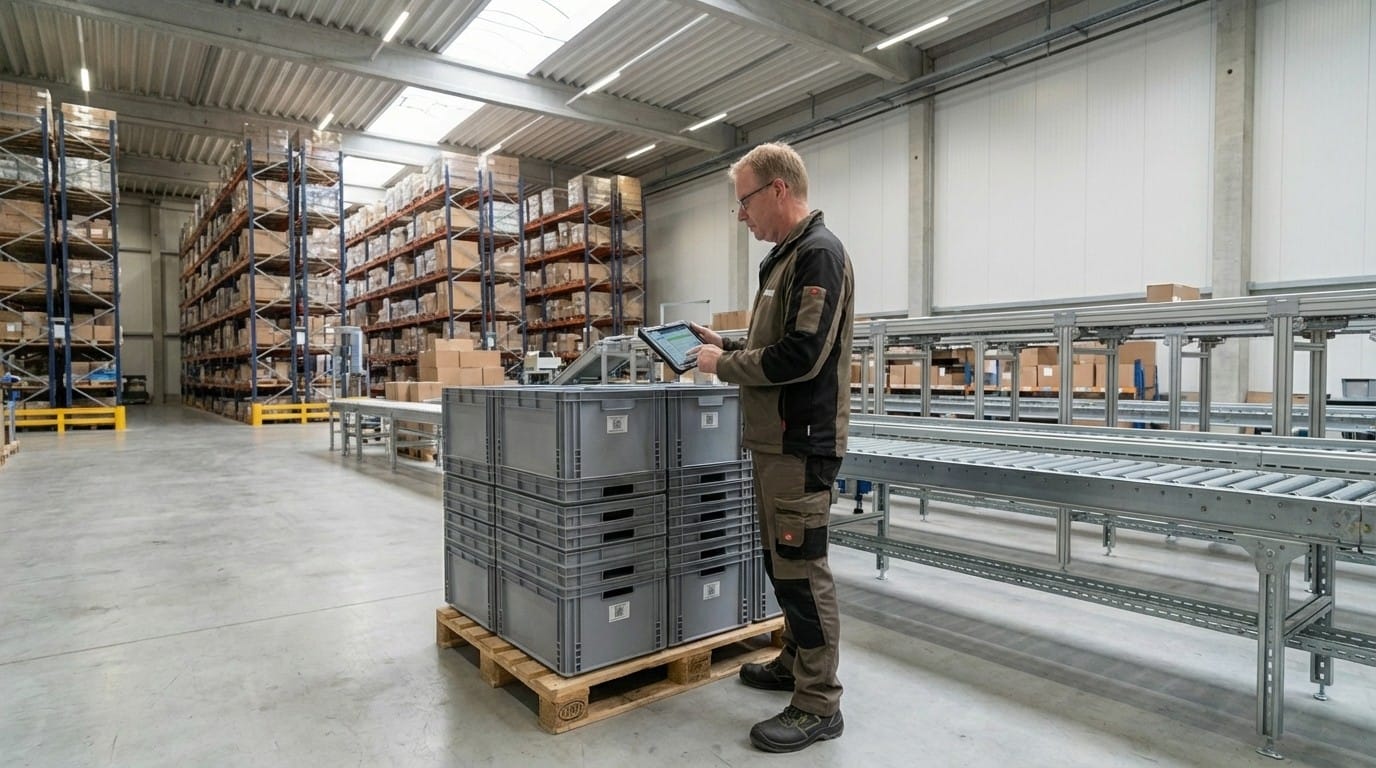
- Identity per item. Each crate, tote or drum carries its own QR code, barcode, RFID tag or GS1 GRAI, so a count becomes a list.
- Custody at every handover. A scan at hand-out, delivery and return records which partner holds what, where, and since when.
- A shared view for partners. Every partner sees its own balance and confirms or disputes handovers on the same record, instead of answering phone calls about counts.
- Deposits per item. A deposit charged on the delivery scan and refunded on the return scan gives every partner a reason to send the packaging back.
Rotion is reusable packaging management software built for exactly this. It keeps one record per asset across every partner, runs deposits and settlements from the scans, and gives each partner its own portal. Customers lose 28% fewer assets and need a 9% smaller fleet, and most teams go live in weeks.
What does the EU PPWR require, and by when?
The EU Packaging and Packaging Waste Regulation, Regulation (EU) 2025/40, turns packaging waste reduction from a target into an obligation. It sets a waste reduction target per Member State and reuse targets per company, and both arrive in 2030. The PPWR Navigator lists every deadline that applies to reusable packaging.
- Article 43, waste reduction. Each Member State must reduce packaging waste per capita by at least 5% by 2030, 10% by 2035 and 15% by 2040, measured against 2018.
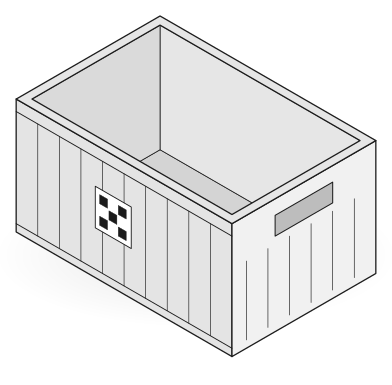
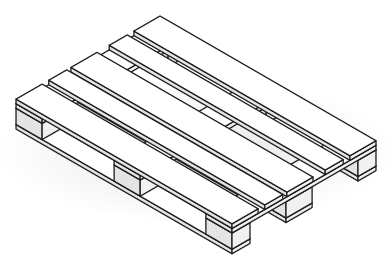
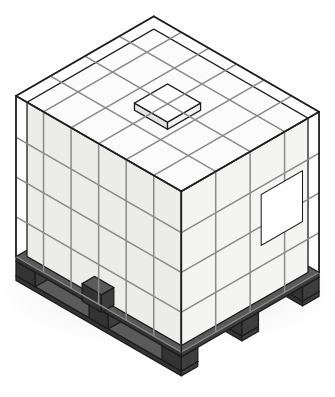
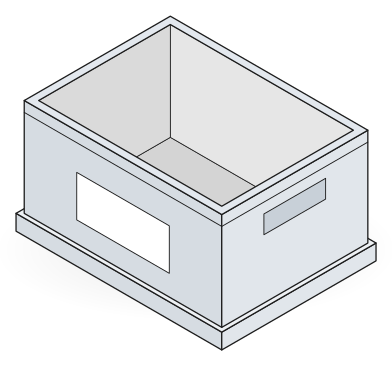
- Article 29, transport packaging reuse. From 2030, a company that uses transport packaging in the EU, such as pallets, foldable plastic boxes, boxes, trays, plastic crates, intermediate bulk containers, pails, drums and canisters, must ensure that at least 40% of it is reusable packaging within a system for reuse. For 2040 the regulation asks companies to endeavour to reach 70%.
- Article 29, grouped packaging. At least 10% reusable within a system for reuse from 2030, with 25% as the 2040 endeavour target.
The two articles pull in the same direction. A company that moves its transport packaging into reuse loops meets its own Article 29 share and removes single-use mass from its Member State’s Article 43 count at the same time.
In the United States the driver is extended producer responsibility for packaging at state level. Programs such as the Oregon Recycling Modernization Act and the Minnesota Packaging Waste and Cost Reduction Act make producers pay fees based on the packaging they put on the market, which rewards less packaging and reusable packaging in the same way.
How do you measure the reduction?
Measure plastic packaging waste reduction per flow, from shipment data, not from the weight of the waste container at the end of the year. The avoided single-use mass equals the cycles completed in the period multiplied by the mass of the single-use unit each cycle replaces, minus the reusable items lost or retired in the same period.
Three figures make that measurable and defensible:
- Cycles per item against the design minimum of the packaging, so you know whether the reusable item has already outperformed the single-use alternative it replaced.
- Reuse rate per packaging category, loop or customer and period, which is the figure PPWR reporting asks for.
- Loss rate per partner, so a falling return rate at one site shows up before it becomes a write-off.
When every cycle is a scan, these figures fall out of the record without a spreadsheet. Rotion’s reuse reporting traces every rate back to the scans behind it, exports it as CSV, PDF or XLSX, and gives auditors a read-only login. For CSRD, those are the figures behind the written disclosure, not the disclosure itself.
Frequently asked questions
Is paper packaging better than plastic for reducing packaging waste?
Usually not by weight. Paper and cardboard already make up 40.4% of EU packaging waste, more than twice the share of plastic, and a fibre alternative often weighs more per unit than the plastic film or tray it replaces. A material switch changes the recycling stream, which can be the right decision, but it does not reduce the quantity of packaging waste. Reuse does.
Does recycled content reduce packaging waste?
No. Recycled content replaces virgin plastic with recycled plastic in the same item, so the mass thrown away after one use is unchanged. PPWR requires minimum recycled content in plastic packaging, which makes it a compliance task. Waste reduction comes from fewer single-use items, through reuse, elimination or lightweighting.
What counts as reusable packaging under PPWR?
Packaging designed to be used several times for the same purpose, within a system for reuse that collects it, cleans it where needed and puts it back into circulation. A plastic crate that a retailer keeps and reuses informally does not count. A crate with an identity, a return path and a record of its cycles does, and that record is what the reuse targets are reported from.
How long before a reuse loop pays back?
It depends on four drivers: the lifetime of the packaging, the cycles it completes per year, the loss rate, and the cost of washing and return transport. A loop with fixed partners and short distances pays back fastest. The economic viability post walks through the calculation; the practical answer is to run one loop with two or three partners for six to eight weeks and measure the four drivers on real data.
Sources and method
The EU waste figures come from Eurostat’s packaging waste statistics (data extracted 10 October 2025) and Eurostat’s news item of 22 October 2025 on plastic packaging waste, both read on 22 October 2026. The regulatory figures follow the text of Regulation (EU) 2025/40, articles 29 and 43, on EUR-Lex, read on the same day; 2040 figures are endeavour targets in the regulation and are described as such here. Repasys figures come from the Repasys case study on rotion.eu, and Rotion’s own figures from rotion.eu’s published pages. Corrections are welcome: if a figure changes, tell us and we will update the page.
About the author. Jonas Janssen is CTO and co-founder of Rotion. He builds the platform described on this page: the asset-level data model, the circulation rules engine and the PPWR reporting layer. Based in Leuven, Belgium. Reviewed by the Rotion team, 22 October 2026.